The Commissioning browser is used to check Signals, Data Sources and Conditions.
The Commissioning browser can be used to check when and whether a Signal, e.g. an analog or digital value, was transmitted. The values are displayed with a warning symbol if the signal has not been active or sent for a long time. It is also possible to check whether the Client's Datasource is active or inactive. If individual sources are inactive, they are displayed in red and with an outdated timestamp. Under Conditions, you can check when they occurred.
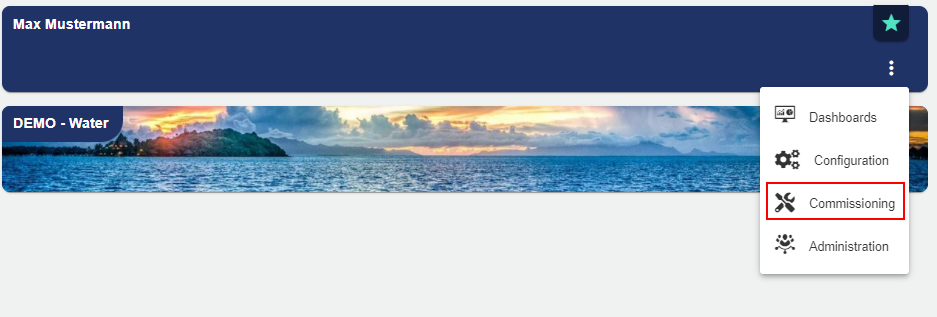
Open the Client's Commissioning function:
Signals
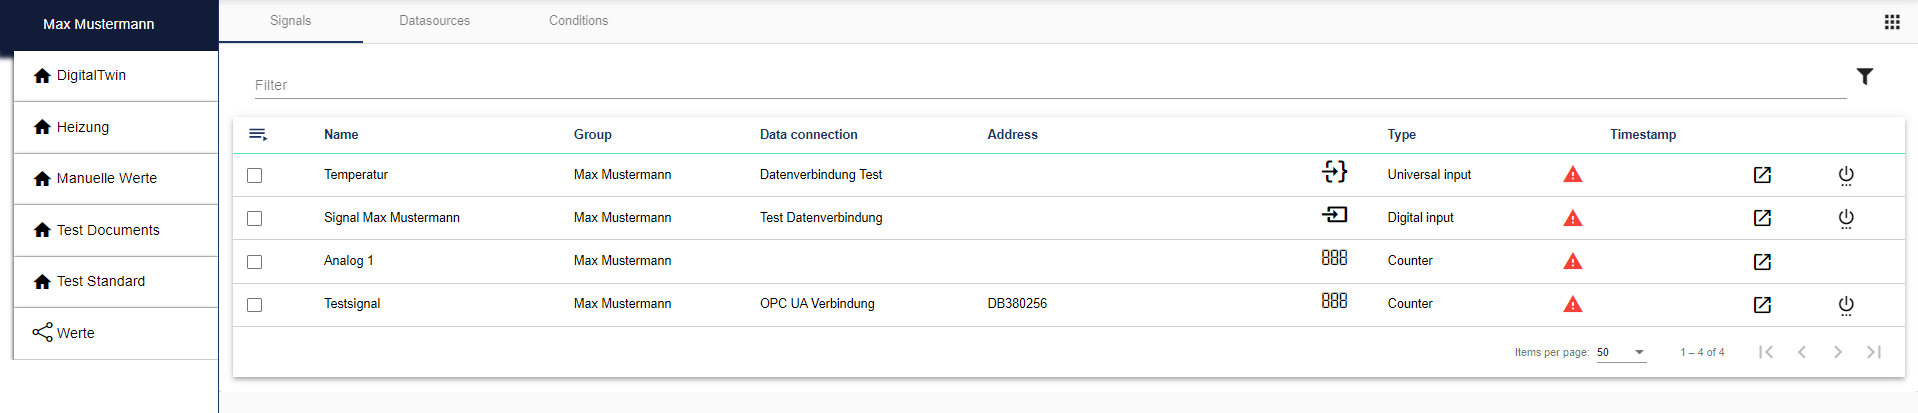
In the "Signal" tab, you can see an overview of the signals created in the Client.
-
The name of the signal is displayed, as well as the group to which the signal is assigned and the data connection that was selected. The address is automatically assigned by the system. The type indicates which signal type was used in combination with a previously selected icon. The red triangle indicates a warning if no values are available. The timestamp shows the date and time of the last signal transmission from the IoT device (e.g. JUMO variTRON 500) to the JUMO smartWARE SCADA data center.
-
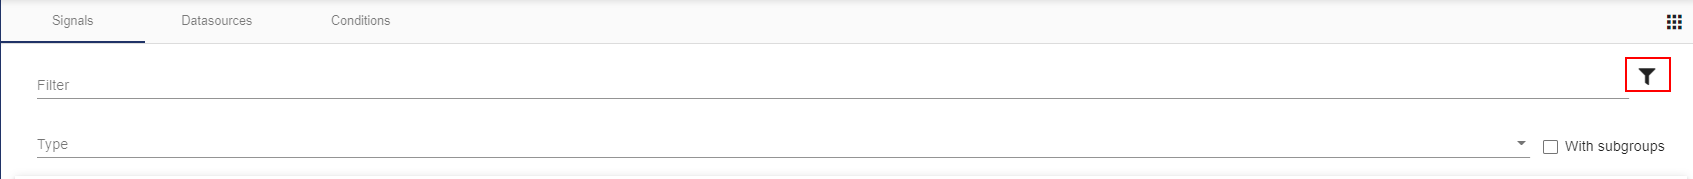
The Advanced Search opens via the "Filter" icon. By checking the box "With subgroups", more detailed information on signals and groups is displayed.
-
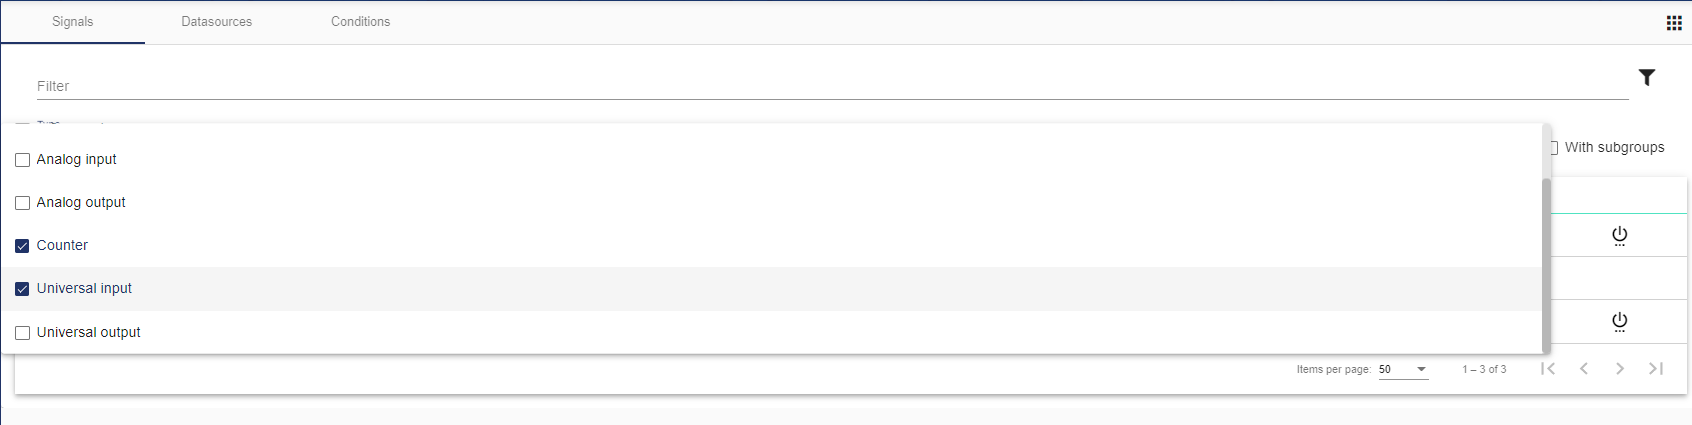
You can pre-filter the signal type using the multiple selection field in the Advanced Search.
-
Digital input
-
Digital output
-
Analog input
-
Analog output
-
Counter
-
Universal input
-
Universal output
-
-
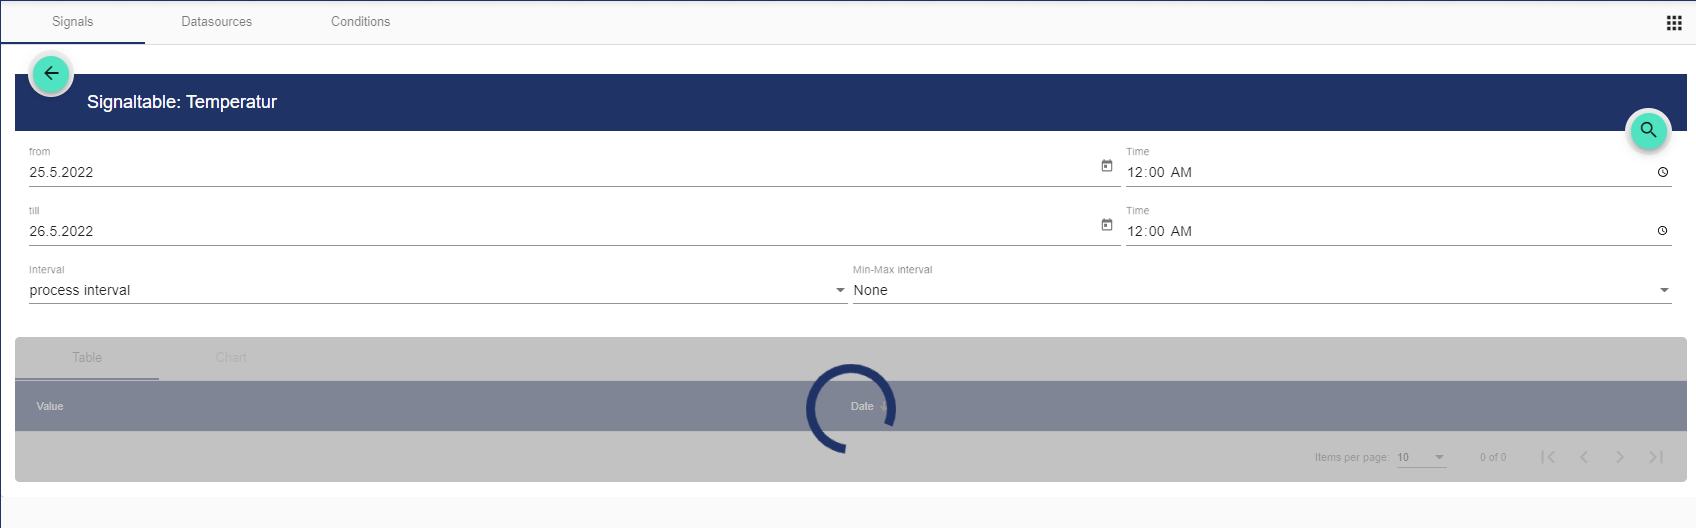
You can view the signal history and thus the temporal transmission of the signal via the icon. Date and time indicate the transmission of the signal. Interval and Min-Max Interval specify the interval type.

-
The data source is activated via the "On/Off switch" icon. This results in a change of the present signal value.

Data Sources
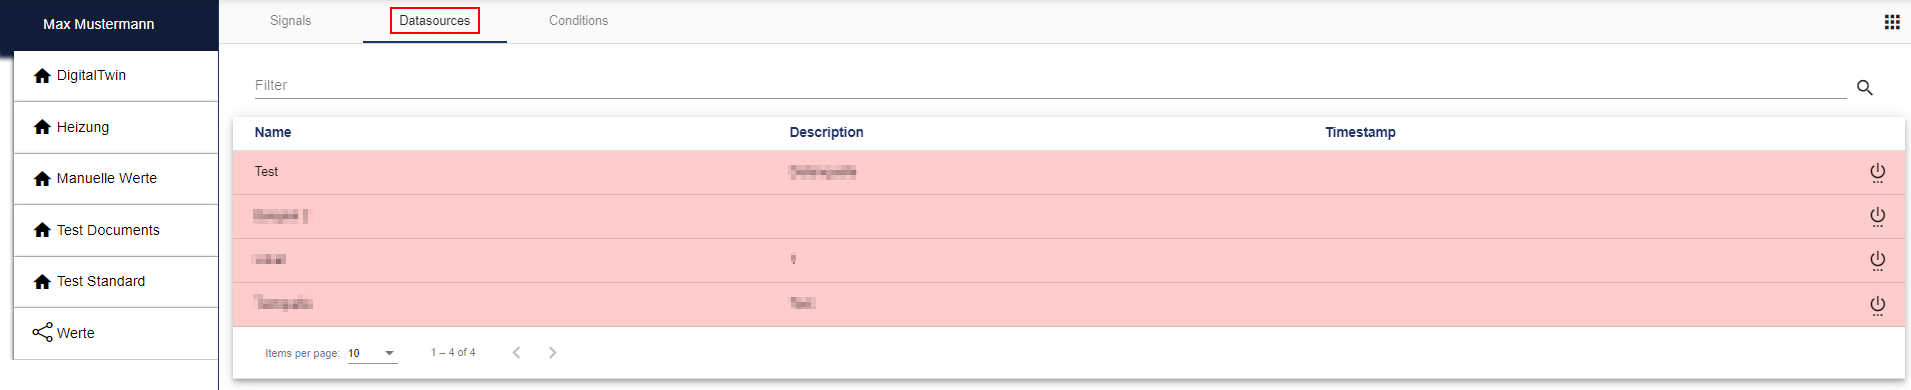
In the "Datasource" tab, you can see an overview of the data sources created in the Client.
-
The name of the data source and the optional description are displayed. The timestamp shows the date and time of the last connection status from the IoT device (e.g. JUMO variTRON 500) to the JUMO smartWARE SCADA data center. This query as to whether the data source is still connected occurs every 30 seconds.
-
Using the "Filter" icon, you can enter a signal name as a search term.
-
The data source is activated via the "On/Off switch" icon. This results in a change of the present signal values, as described in Widget: Live Mode.
-
If the line is highlighted in red, the timestamp is out of date and the connection to the data source is broken.
Conditions
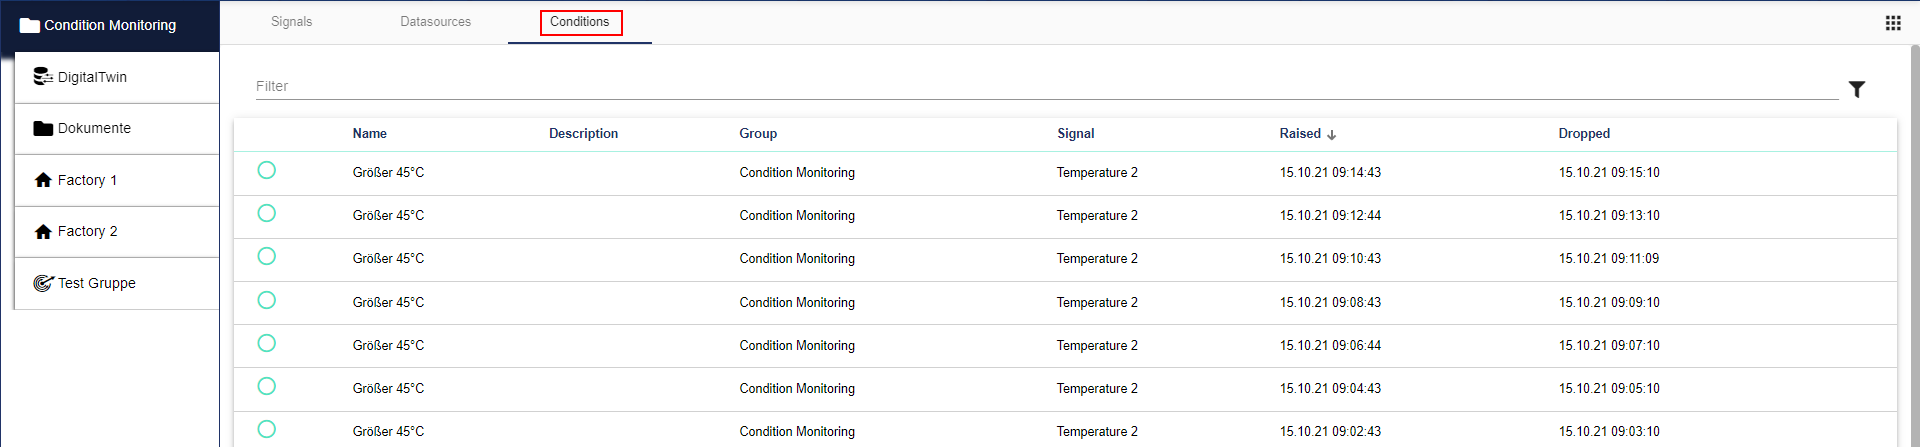
In the "Condition" tab, you can see an overview of the conditions set in the Client.
-
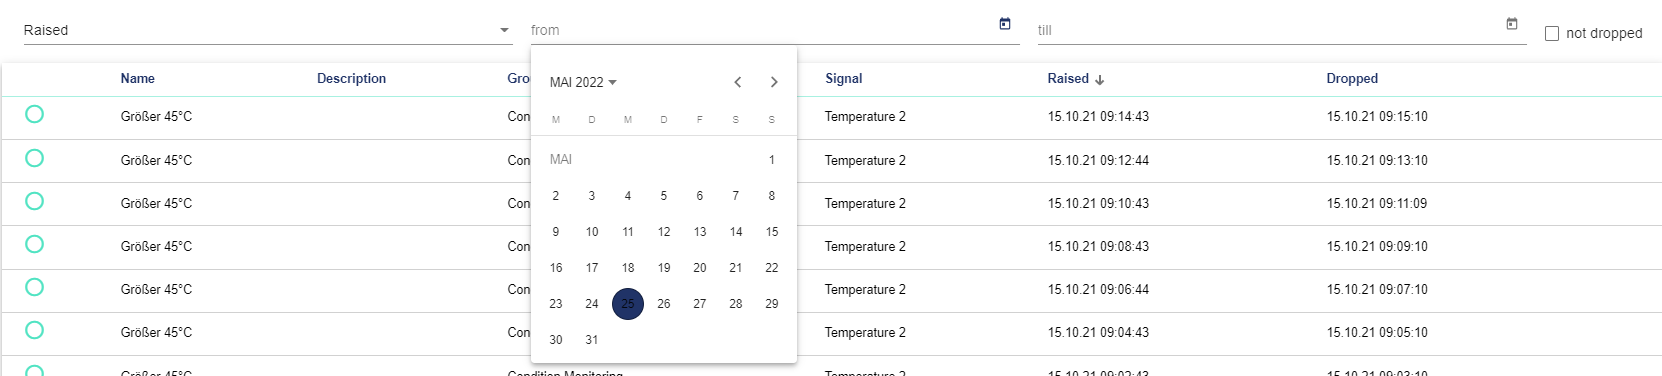
The name of the condition is displayed, as well as the optional description, the group to which the signal is assigned and the signal that was selected. In addition, the Raised and Lowered columns indicate the time at which the signal fulfills or no longer fulfills the set condition. "Raised" is the time at which the signal was fulfilled and "Lowered" is the time at which the signal is no longer fulfilled.
-
The filter can be used to search for the condition names (signal). The Advanced Search opens via the "Filter" icon.
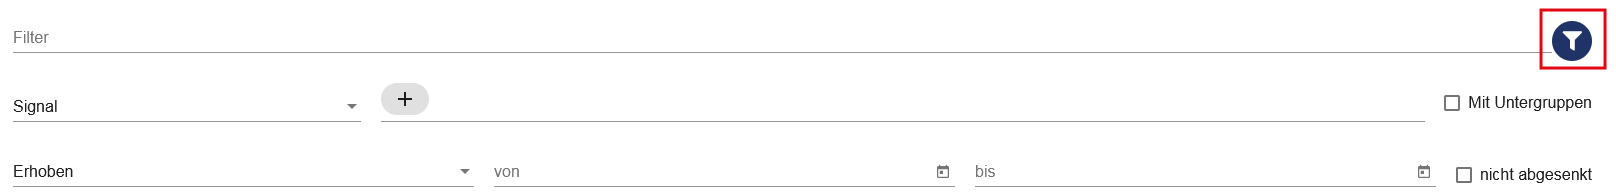
You can use the advanced search to pre-filter further details on signals or conditions.
-
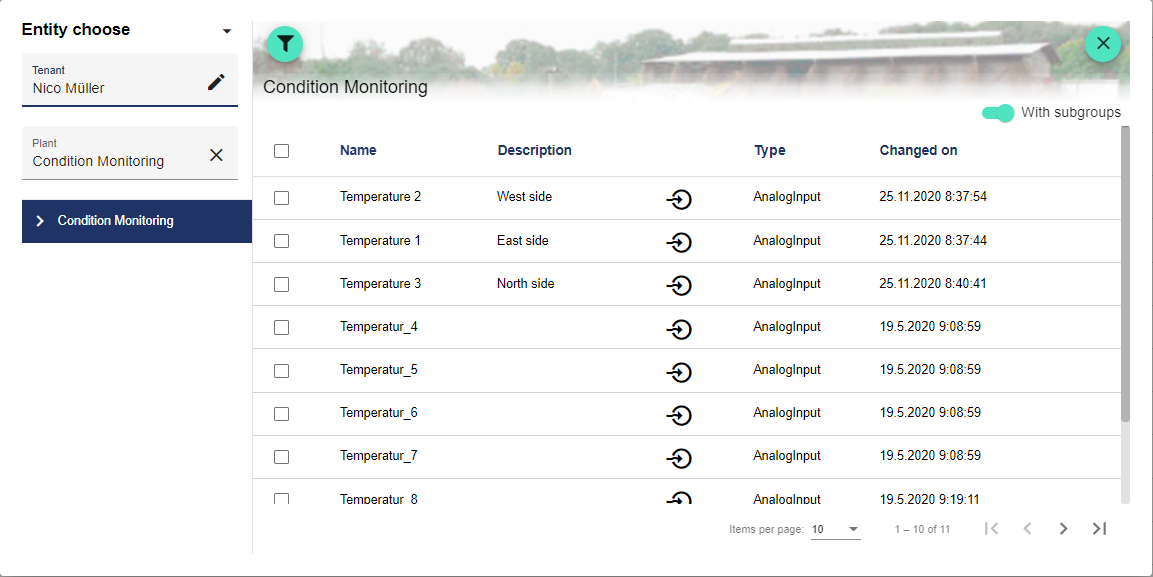
The Plus button opens another window (also see the chapter "Select Entity" in Configuration Basics), which can be used to select a previously created signal or condition.
-
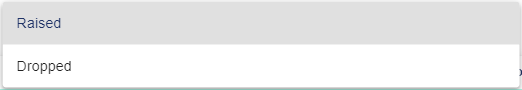
You can also pre-filter between "Raised" and "Lowered". And narrow the search to a specific time period (only functional in conjunction with "from/to"). If the "not lowered" checkmark is activated, all active conditions are displayed. "Raised" is the time at which the signal was fulfilled and "Lowered" is the time at which the signal is no longer fulfilled.