
Use
The Live Chart presents a live view of selected analog or digital data records, which updates cyclically in real time.
The Live Chart is used to display a relatively short time range (less than 1 day). The values are updated every second.
Unlike the Time Variation Chart widget, it is not possible to evaluate past periods or use Bar and Step Line Series in the Live Chart.
|
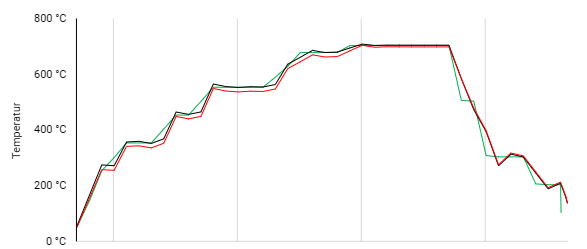
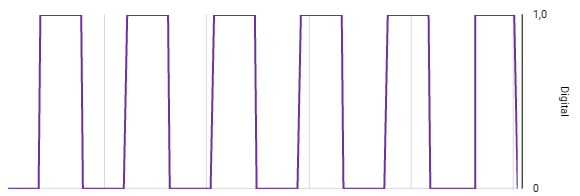
Analog values as a line chart |
Digital values as a line chart |
|---|---|
|
|
If you want to view individual signals and hide others, you can deselect and hide the signal by clicking it in the legend. This brings other signals into focus.
Configuration
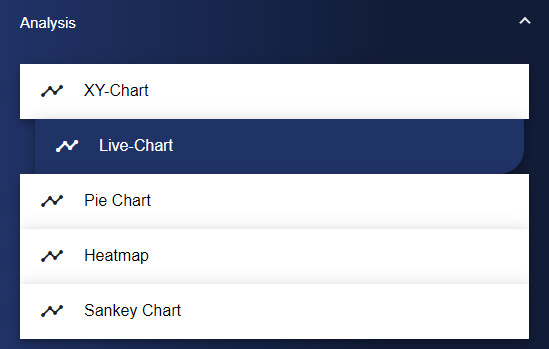
Select the Live Chart widget from the Analysis category.
Assign a suitable title in the Basic Configuration for the Live Chart. The header can be displayed by selecting the check box.
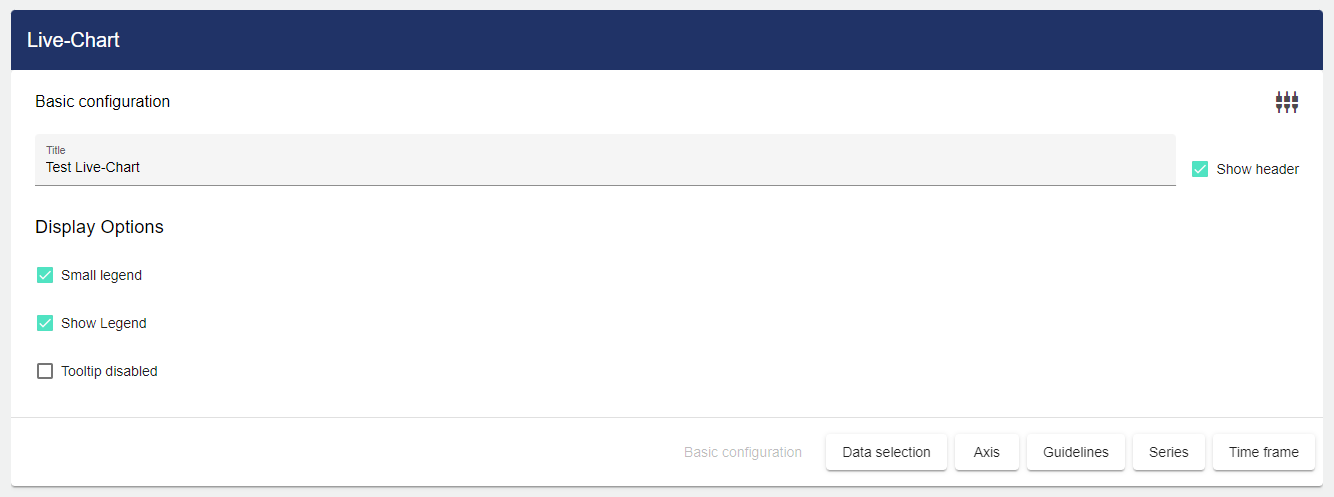
Then click the "Data Selection" tab.
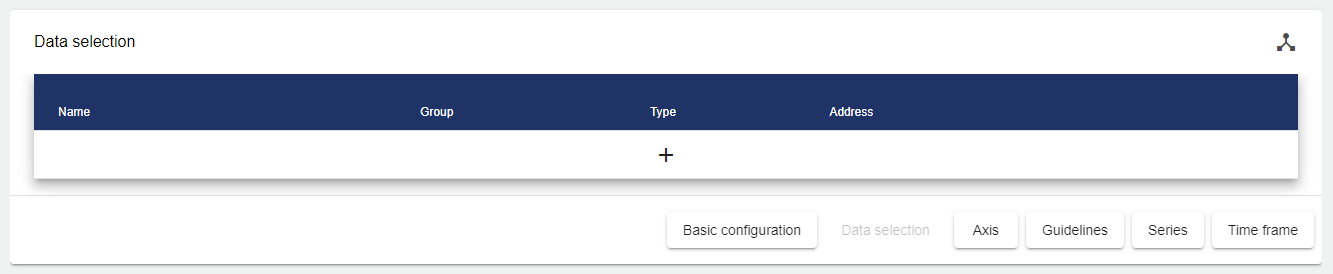
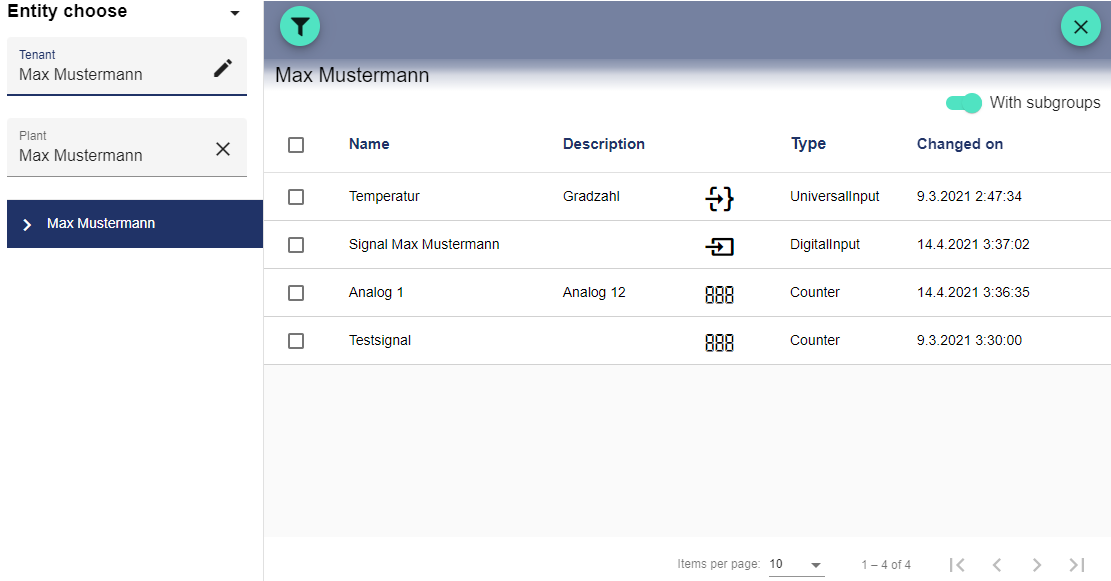
Clicking the Plus button opens the Entity-Select window. You can add a previously created signal here. The checkboxes can be used to mark multiple signals and select them all simultaneously.
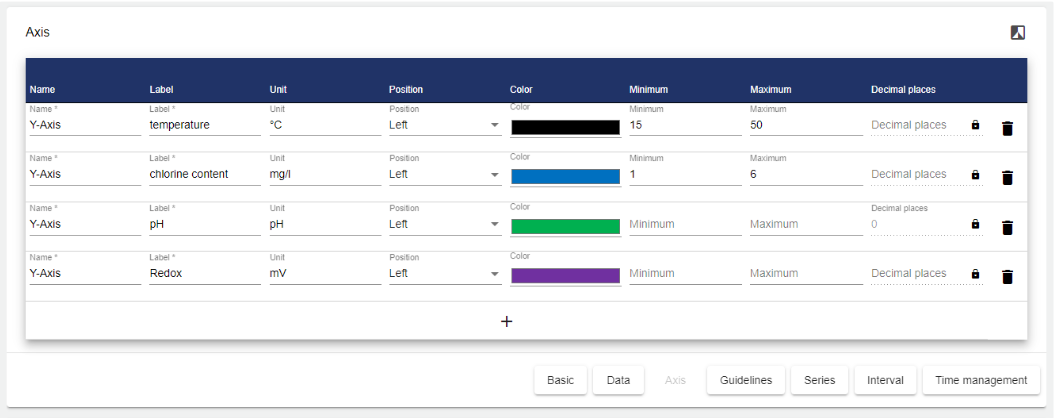
Then click the "Axis" tab to define your axis label. You need to specify the labeling for the axes. The unit, position, color, minimum, maximum value and decimal places can be used if required.
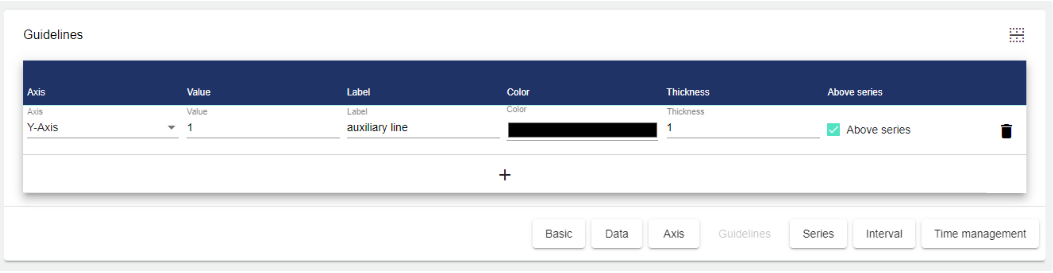
Guide lines can be added in the next field. Here you need to select the axis for which you want to create the guide line. The value defines where the guide line is displayed. Labeling is optional. You can also select any color and the thickness of the line. The "Above series" checkmark indicates whether the guide line is visible in the layer above the chart or displayed in the background behind the chart.
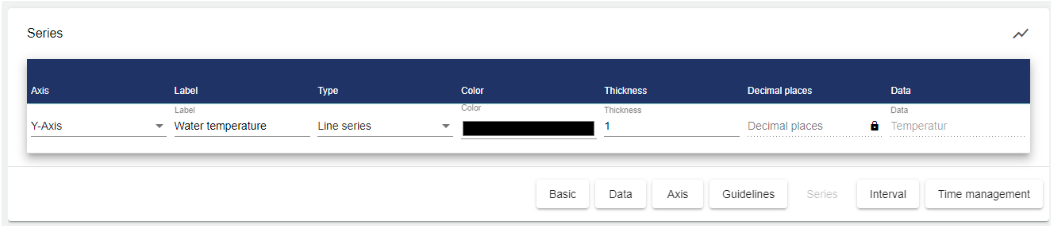
A series is automatically created for all selected data points. A suitable axis must be assigned for each signal. You also have the option to specify the label, color, line thickness and the decimal places in the chart. The "Signal" column shows the name of the stored signal.
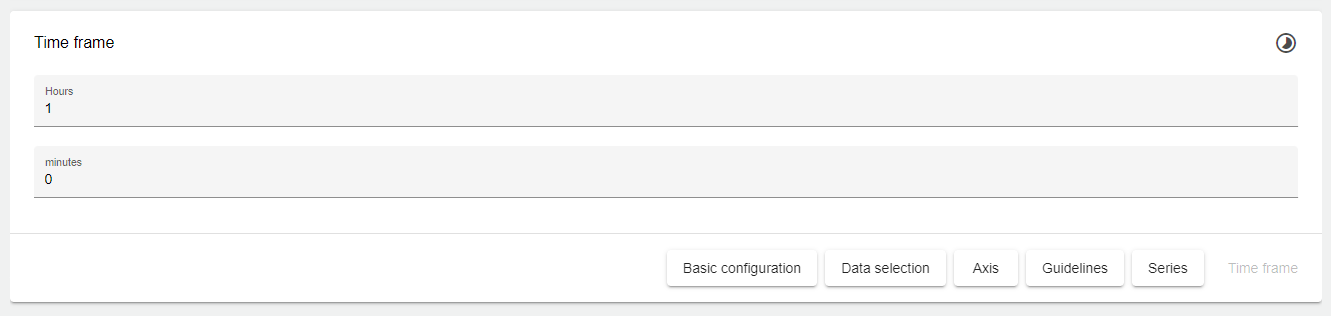
In the "Time frame" tab, you specify the time frame to be displayed in the chart.
Once you are satisfied with your configuration, you can save it.