
In this window, the presentation of the displayed chart can be edited. Changes are applied by clicking outside the window.
General
Analog
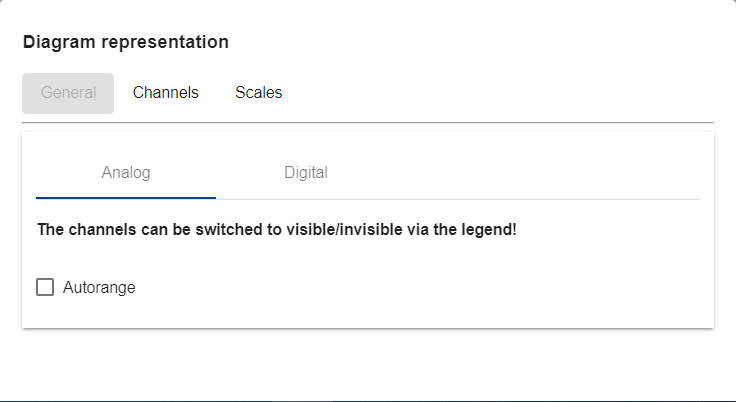
In the Analog tab, the Autorange function can be activated and deactivated
Digital
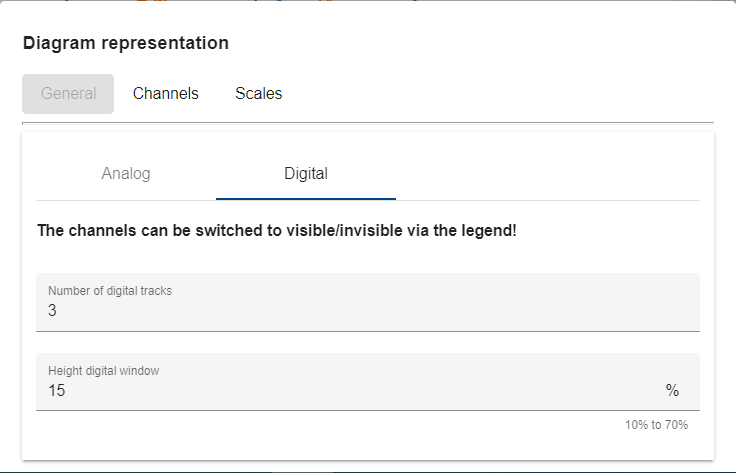
In the Digital tab, the number of digital tracks and the height of the digital window can be adjusted.
Channels
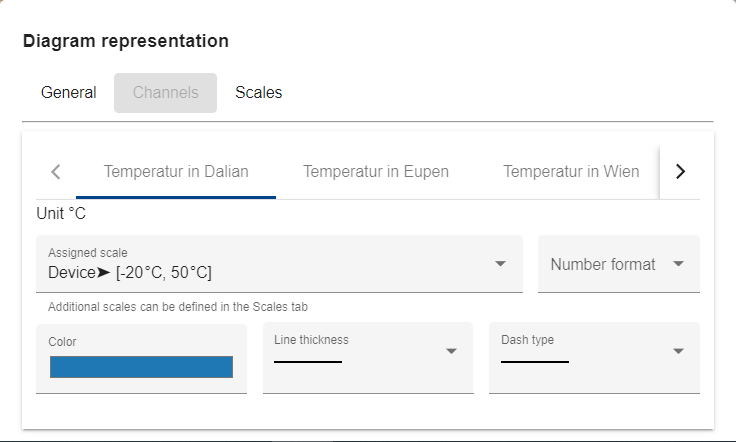
In the Channels tab, the following settings can be made for each channel.
-
Assigned scale
-
Number format
-
Color of the line in the chart
-
Line thickness of the line in the chart
-
Line type of the line in the chart
Scales
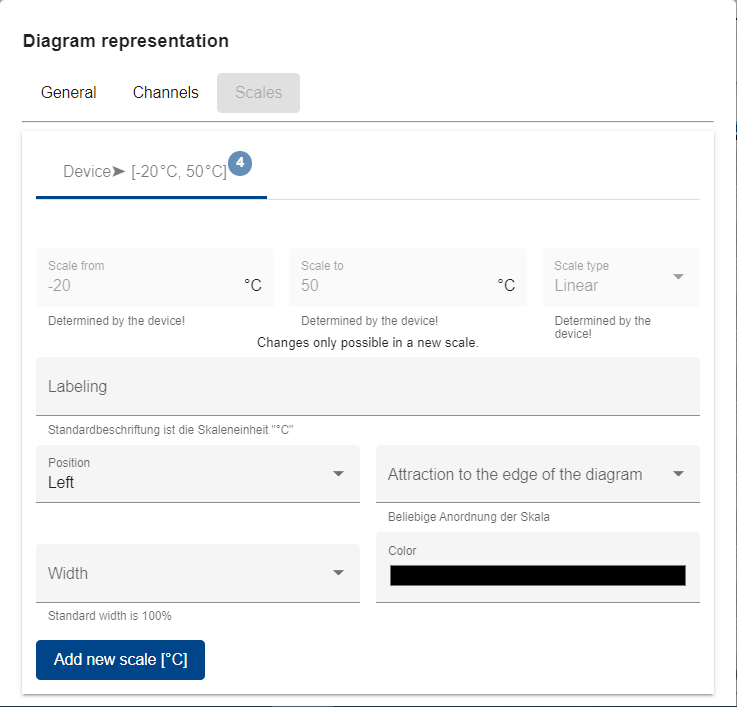
In the Scale tab, existing scales can be edited and new scales can be added. The following setting options are available:
-
Scale from (for newly created scales)
-
Scale to (for newly created scales)
-
Scale type (for newly created scales)
-
Labeling
-
Position
-
Width
-
Attraction to the edge of the chart
-
Color of the scale
Scale types:
-
Scale type Linear: Scales are displayed linearly. Thus, the exact value in the scale is shown.
-
Scale type Logarithmic: Scales are displayed as percentages. This type of display is used to prevent an optical influence by the scale.
Creating a new scale
Clicking the Add new scale [x] button creates a new scale tab in the window. New scales can only be created for already existing units (in the screenshot: °C).
To display a scale in the chart, a channel must be assigned to the scale. The channels must correspond to the unit of the scale.