Navigate to Dashboard
There are two ways to navigate to a Dashboard:
-
Select Dashboard
-
All Dashboards
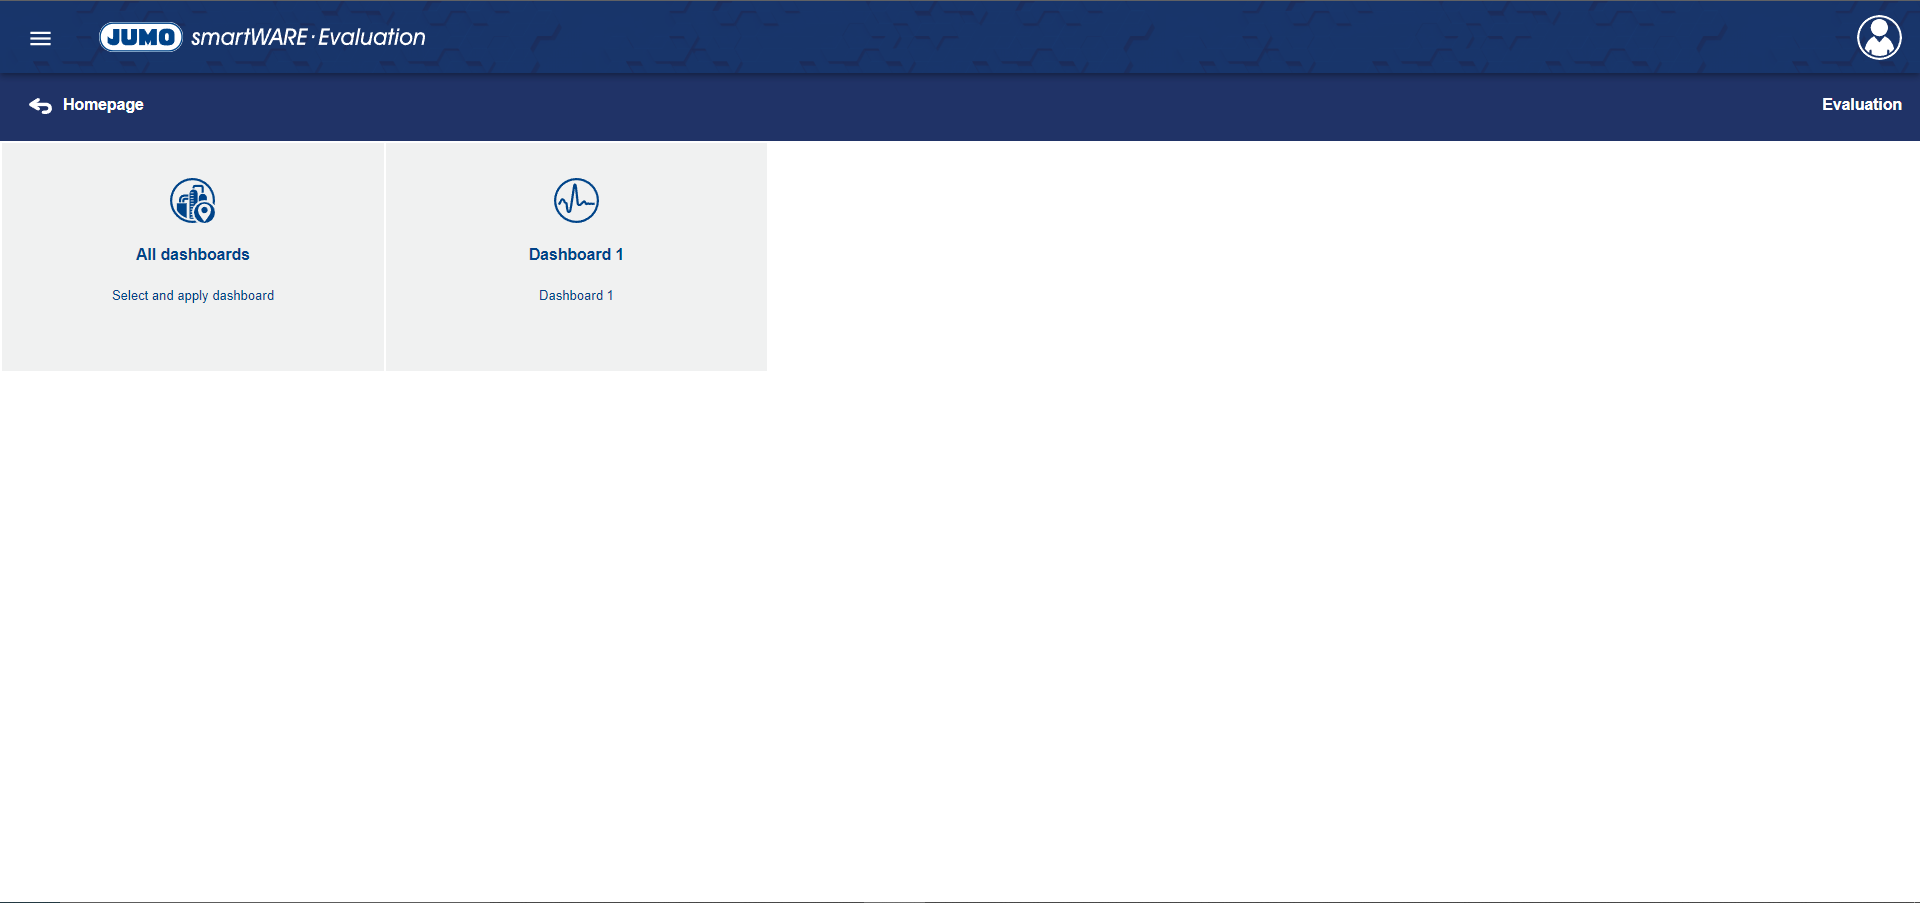
Select Dashboard
If the name of the Dashboards is known, the Dashboard can simply be selected in the start screen of the Evaluation area.
All Dashboards
Clicking the field "All Dashboards" opens a new window
The System/Device Overview can be used to navigate to the individual Dashboards in this area.
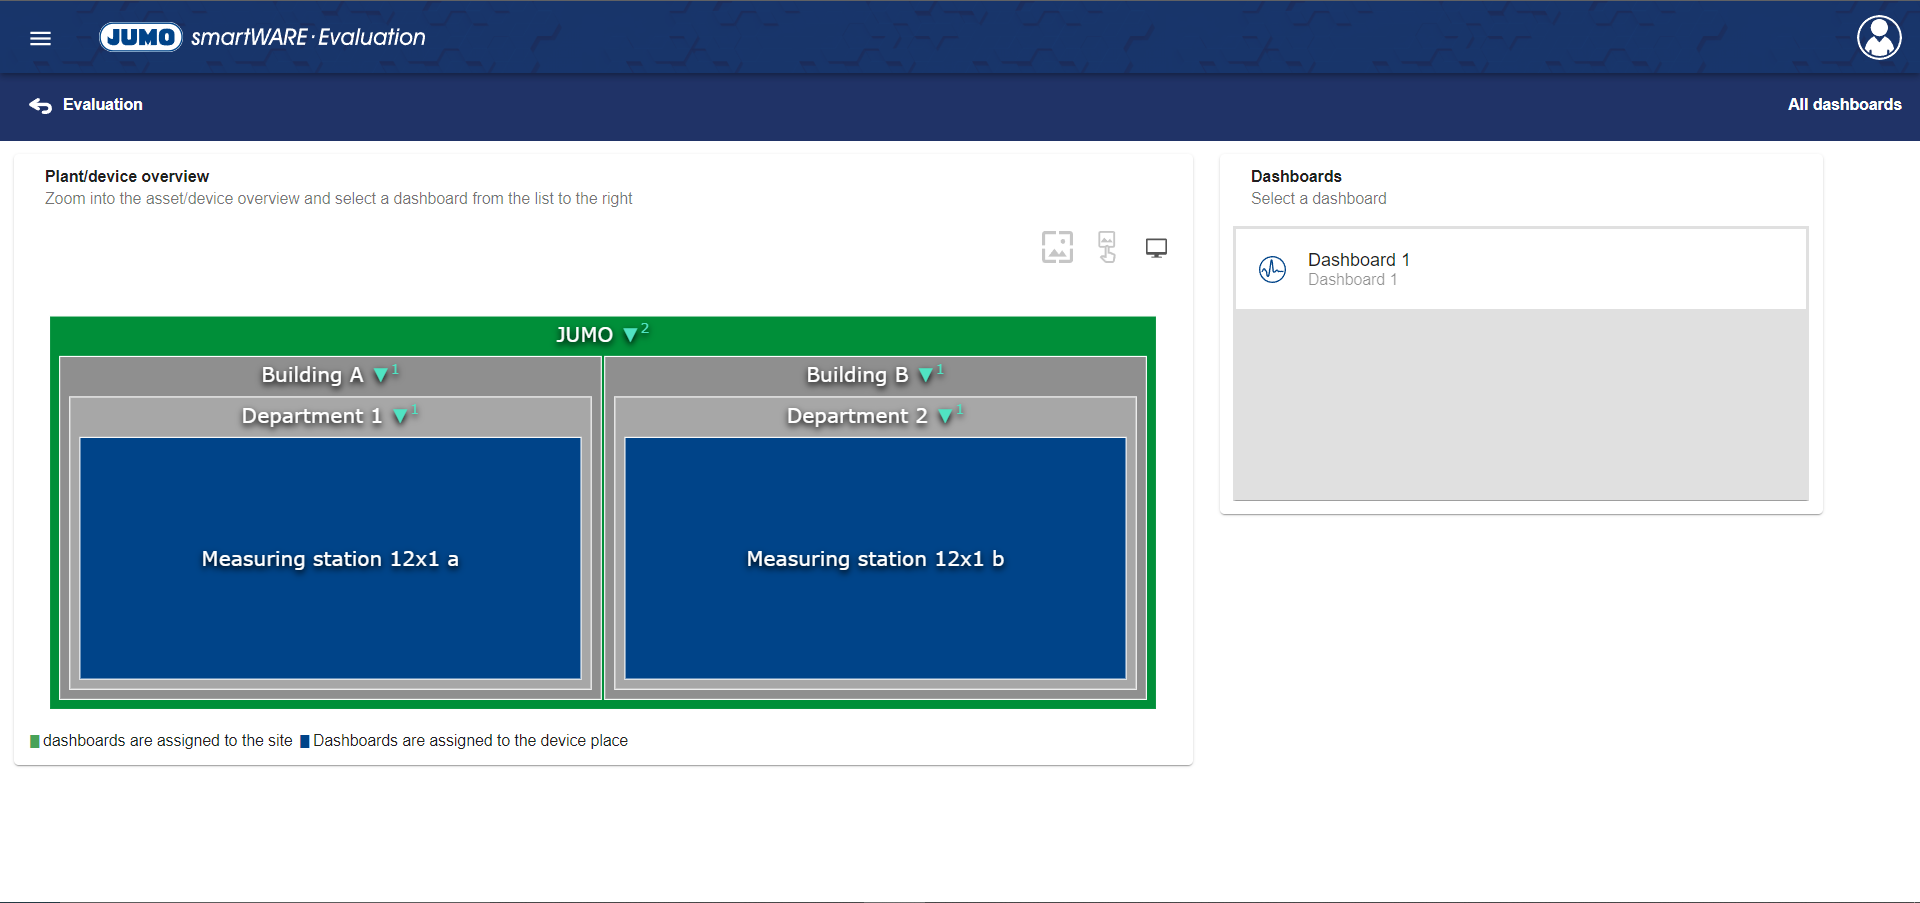
The Dashboards can be found at the site/device location that was selected in the Dashboard creation process!
The list on the right half of the screen shows all Dashboards that are within or below the selected site/device location.
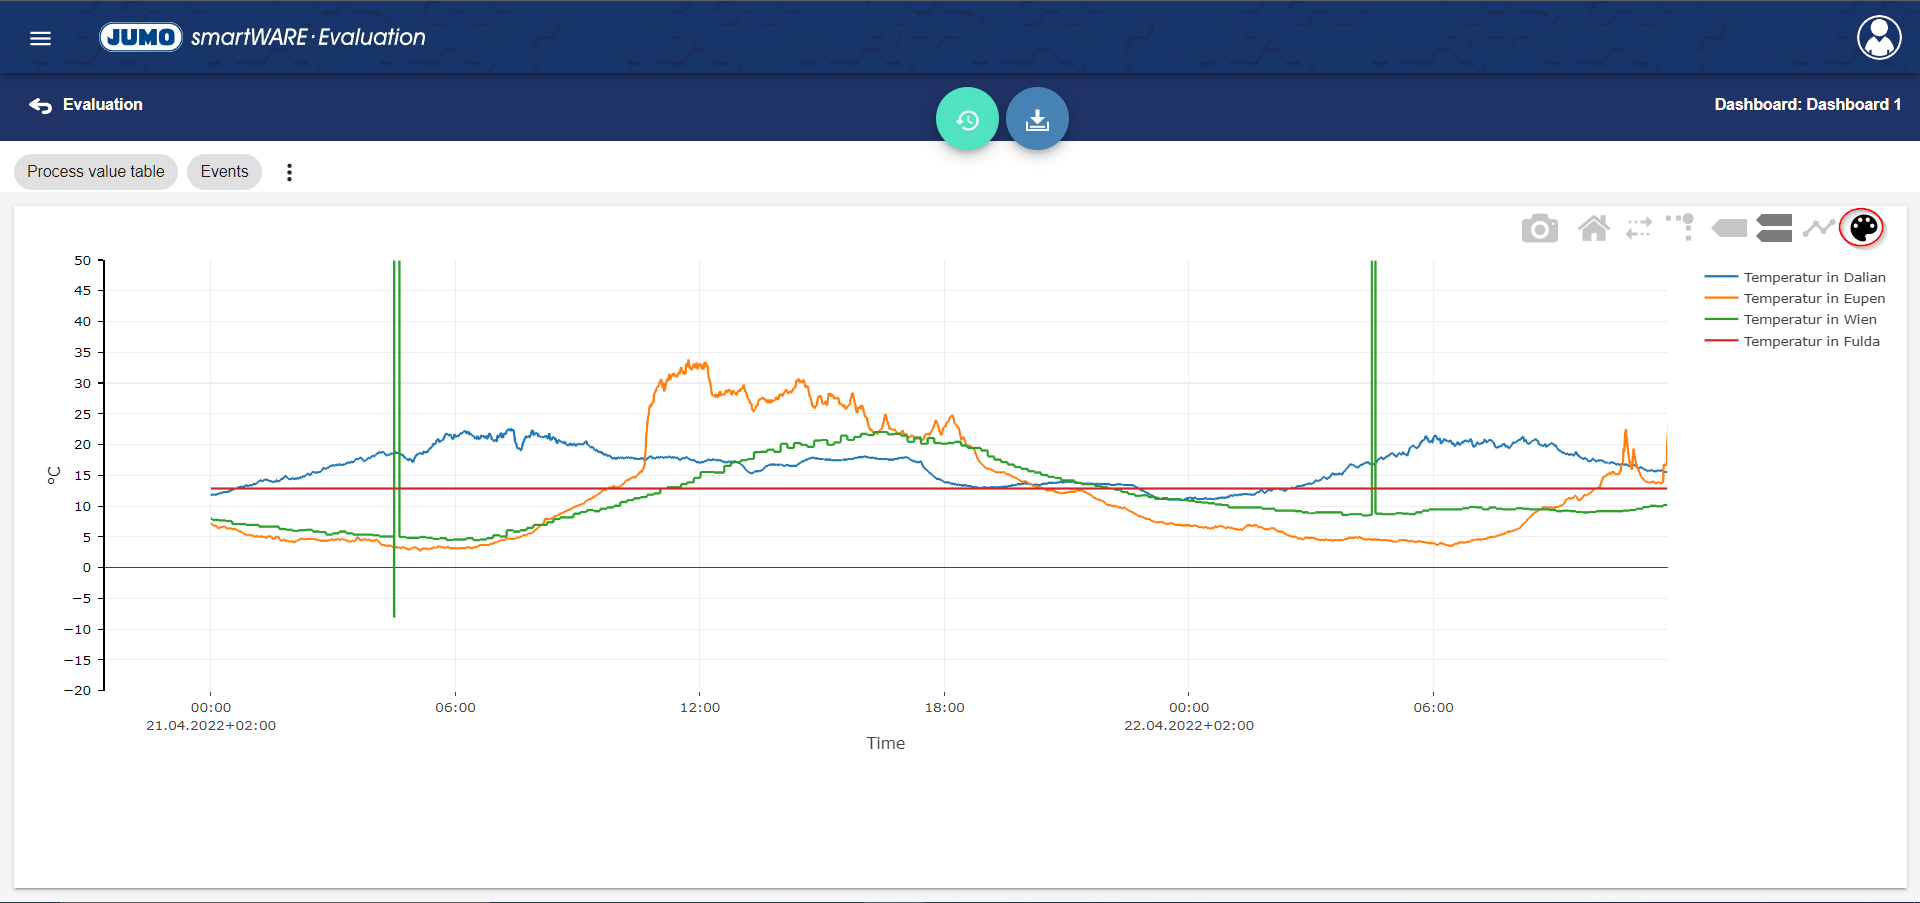
Evaluate Dashboard
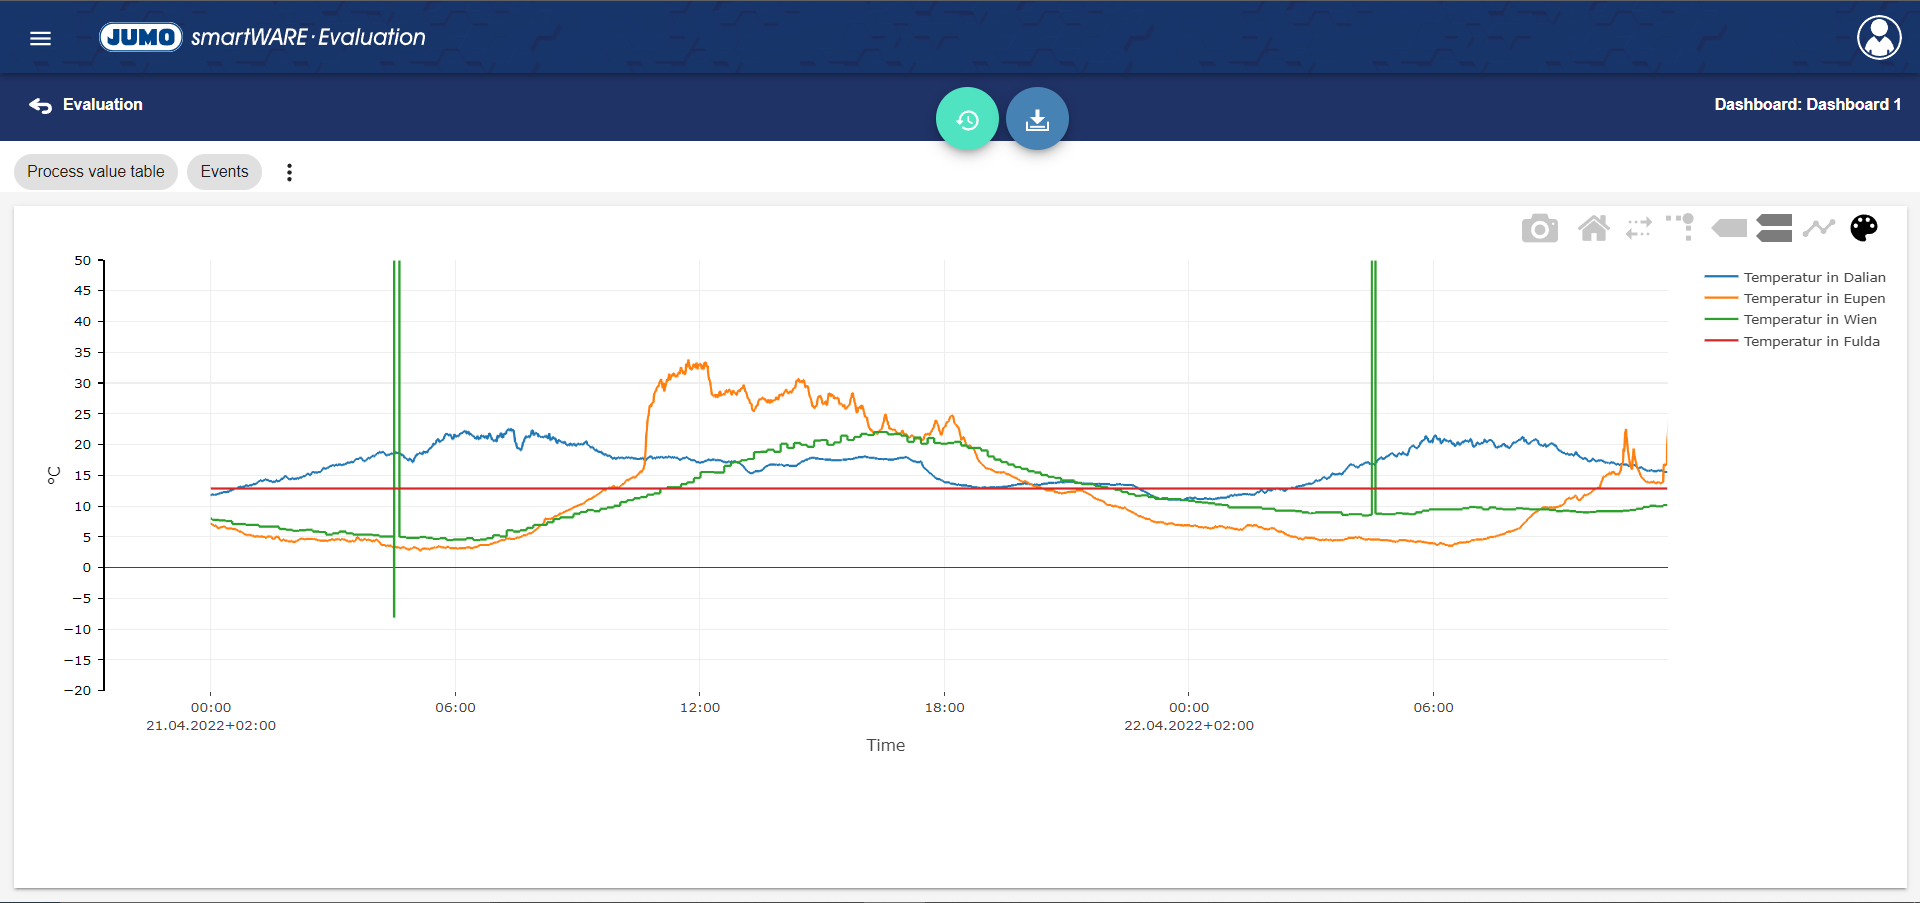
After navigating to the Dashboard to be opened, the Dashboard opens by left-clicking the respective menu item or list entry of the Dashboards.
The application offers a great deal of assistance for the evaluation of the Dashboards.
-
Process Value Table
-
Events
-
Menu
Process Value Table
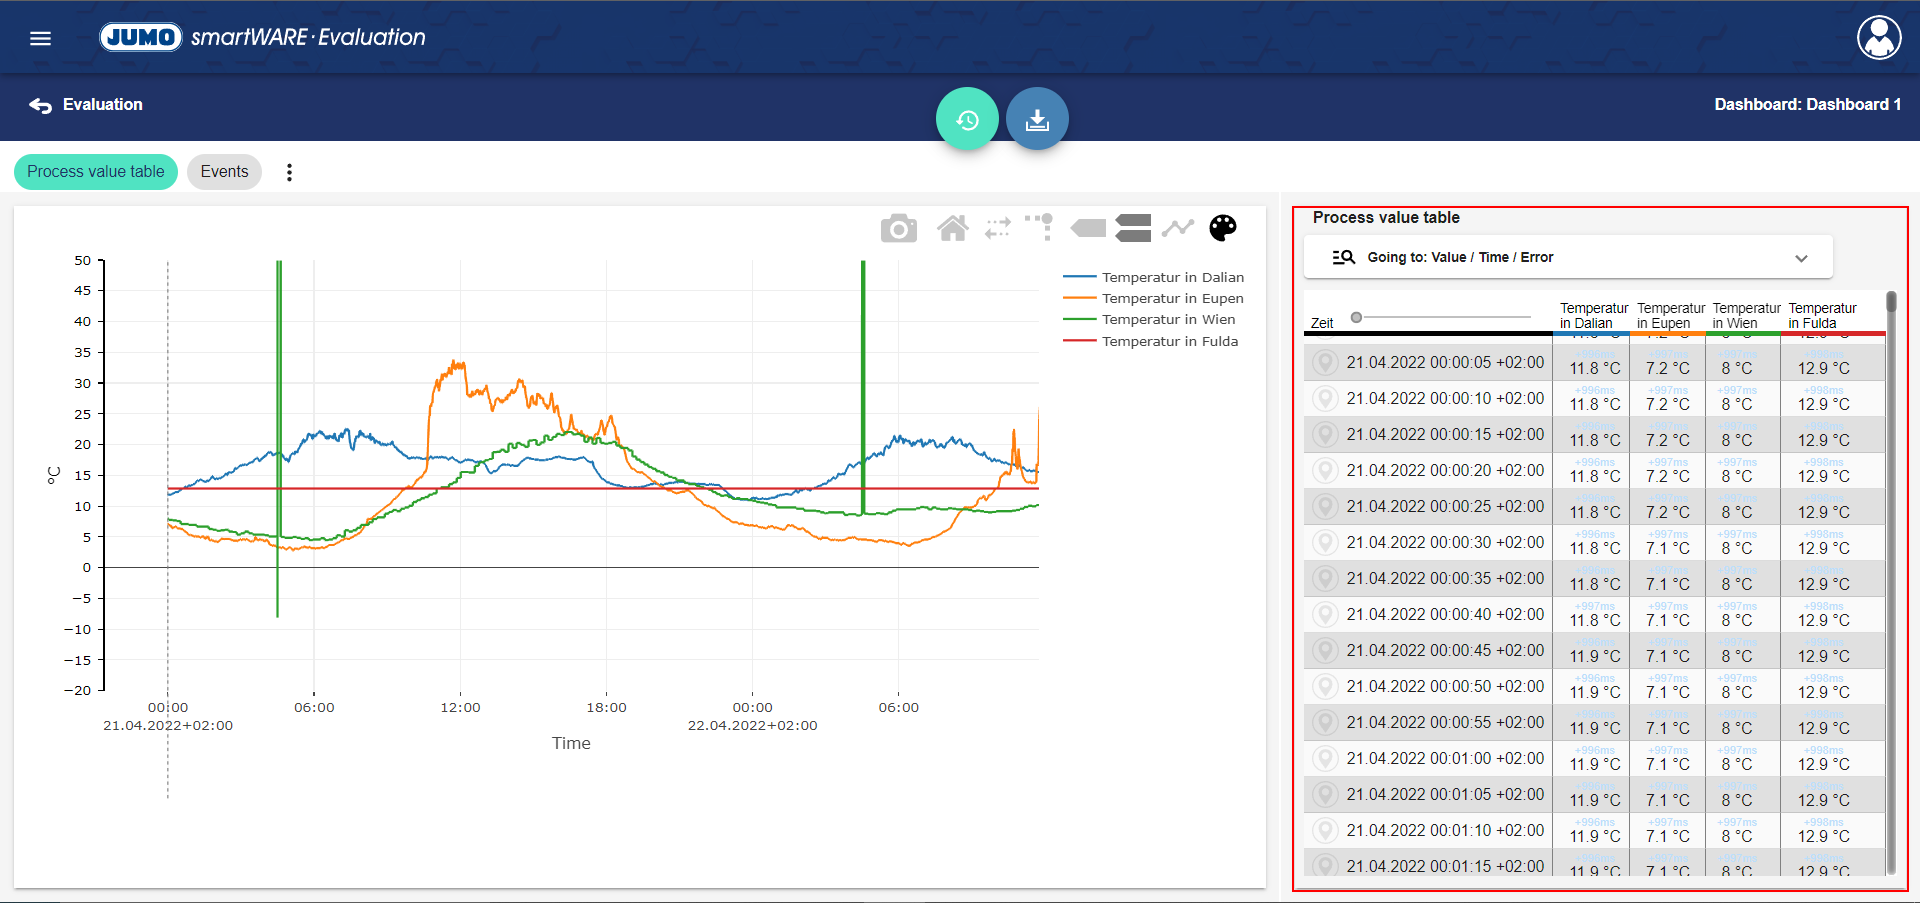
The Process Value Table gives an overview of all available values of the various mapped channels for the Dashboard.
When scrolling in the table with the mouse wheel or the scroll bar at the right edge, a window opens with the following query:
"Use mouse pointer movement in chart to scroll the table?"
If the answer to this query is "Yes", the table automatically displays the values that were hovered over in the chart. This also works the other way around, so that in the chart a guide line shows the row of the table in which the mouse pointer is located
Clicking with the left mouse button closes this function.
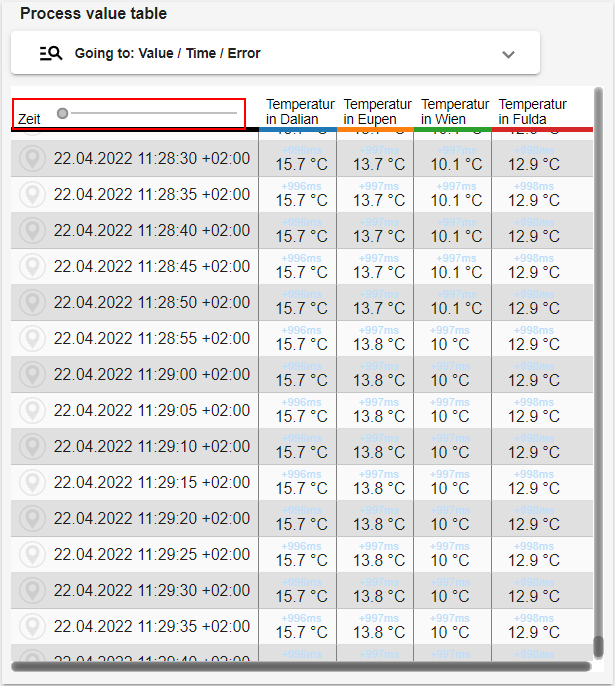
It is possible to set a marker in the chart for individual values. Left-clicking on a table row activates the marker for this value. Using the slider in the Process Value Table, it is possible to jump from one marker to another.
“Go to” Function
The "Go to" Function is described in the following section: “Go to” Function
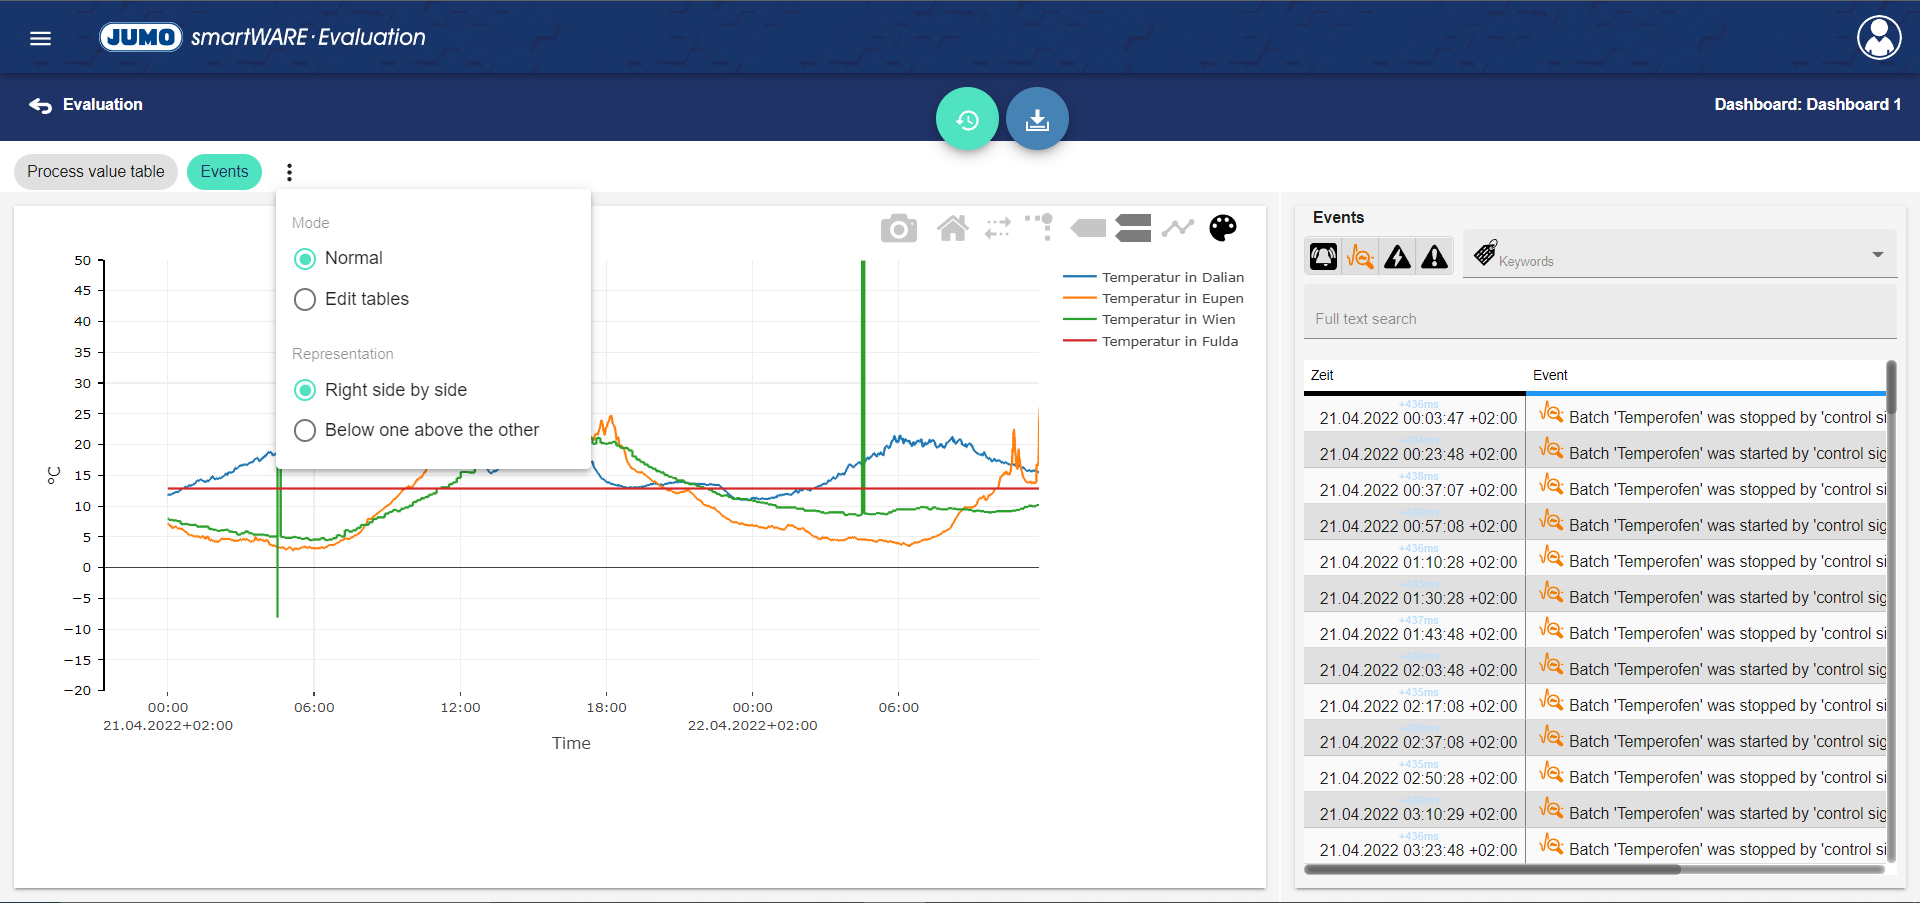
Events
The Events area provides an overview of all events that affect this Evaluation.
There are a number of filter options that allow you to adapt the overview to your own needs:
|
Field |
Definition |

Alarm |
All events in the Alarm category can be shown and hidden |

Audit Trail |
All events in the Audit Trail category can be shown and hidden |

Fault |
All events in the Fault category can be shown and hidden |

Event |
All events in the Event category can be shown and hidden |
|
Keywords |
In the Keywords field, you can filter for keywords that are stored in the values |
|
Full Text Search |
You can search for text fragments in the Full Text Search field |
Menu
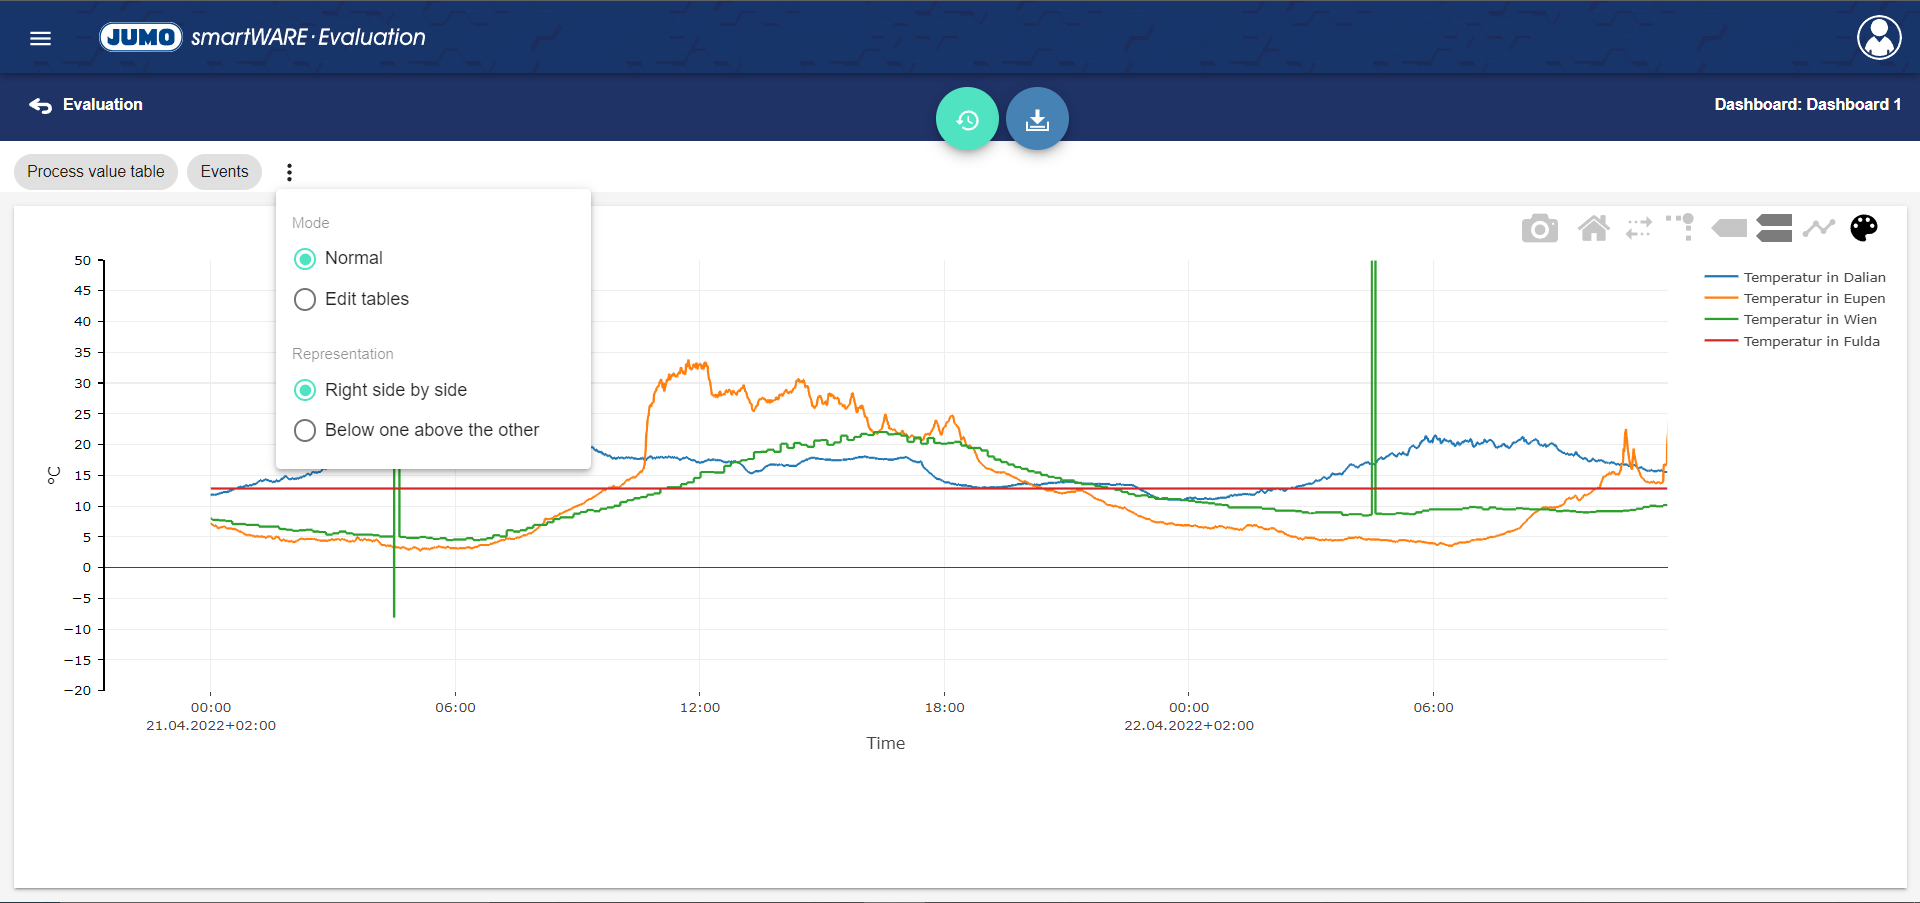
The presentation of the page can be customized in the Menu area
Mode
There are two options to choose from here:
-
Normal → The page is in its original form
-
Edit Table → A new button for the Process Value Table and Events appears on the page, which can be used to define the division of the tables and presentation.
Clicking the button allows you to adjust the aspect ratio of the three possible windows.
Presentation
You can decide on the arrangement of the windows here. The names of the options are self-explanatory:
-
On the right, side by side
-
Below, one above the other
The screen is always arranged in the following order: Display → Process Value Table → Events
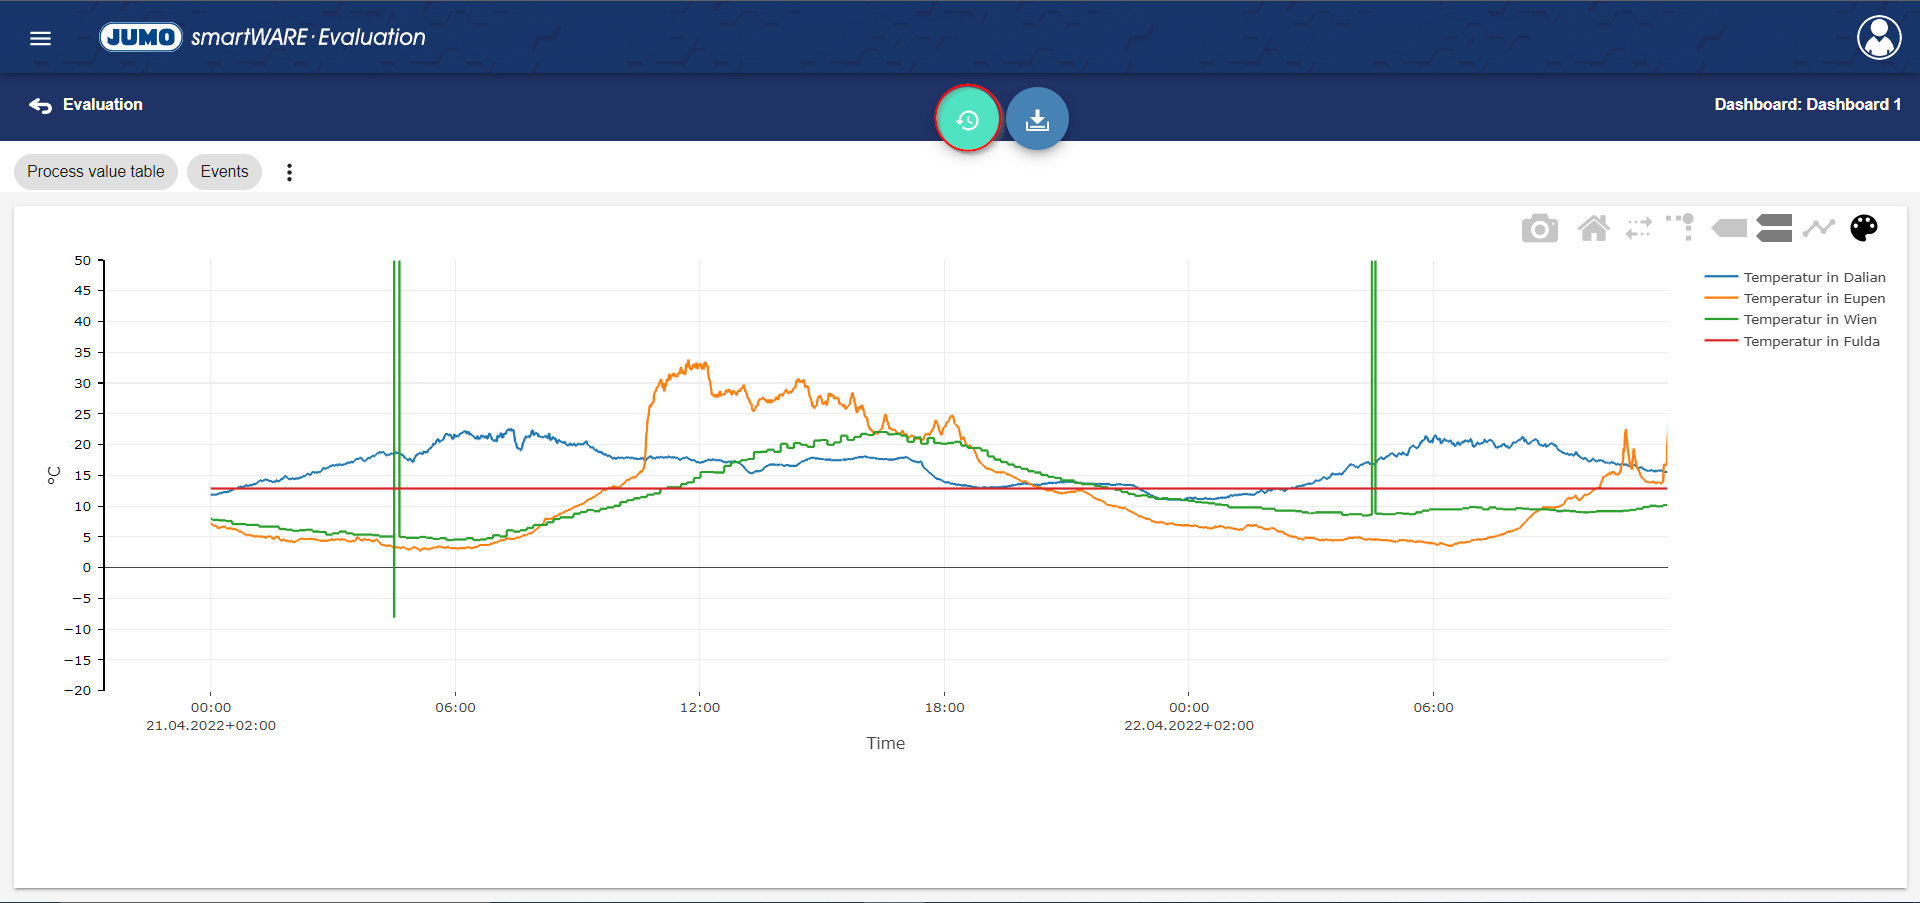
Time Navigator
Clicking the button "Time Navigator" opens the Time Navigator.
Edit Chart Presentation
Clicking the button "Edit Chart Presentation" opens a window for editing the Presentation of the Chart.