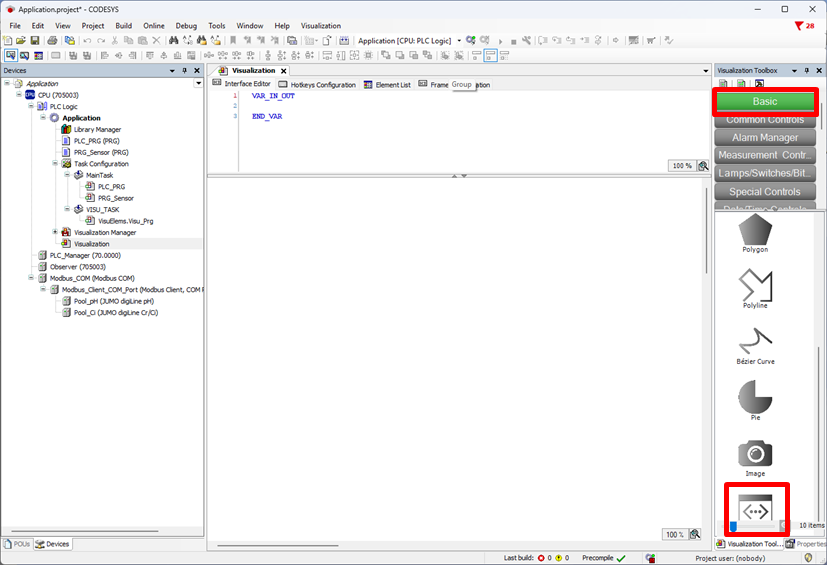
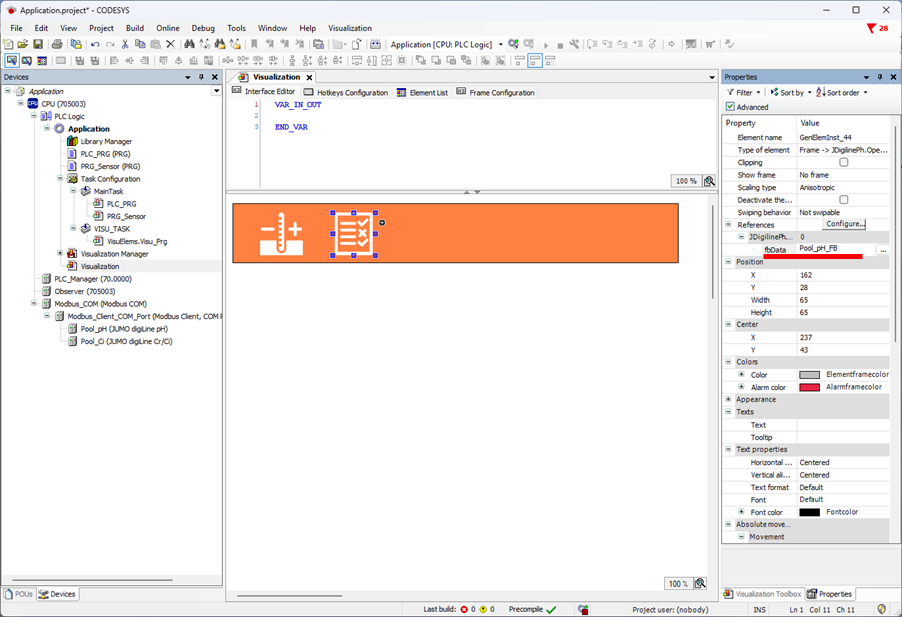
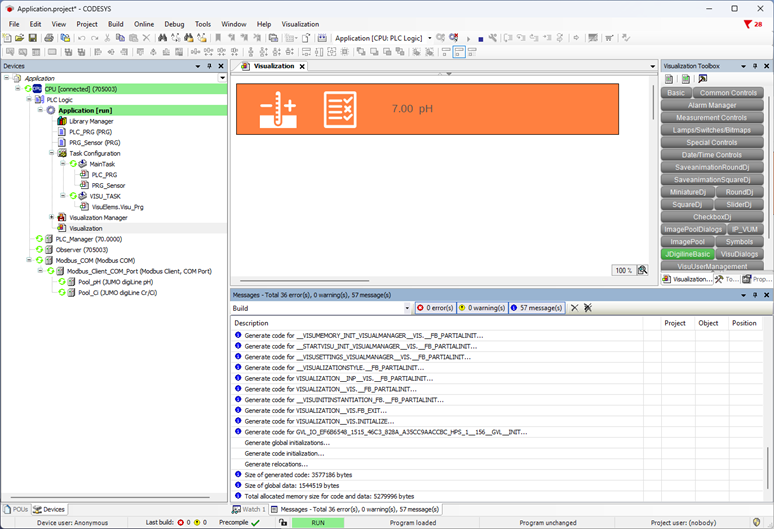
An individual visualization object is built for the pH sensor in the following example. The Frame object can be pulled into the product from the Vizualization Toolbox/Basic for this purpose.
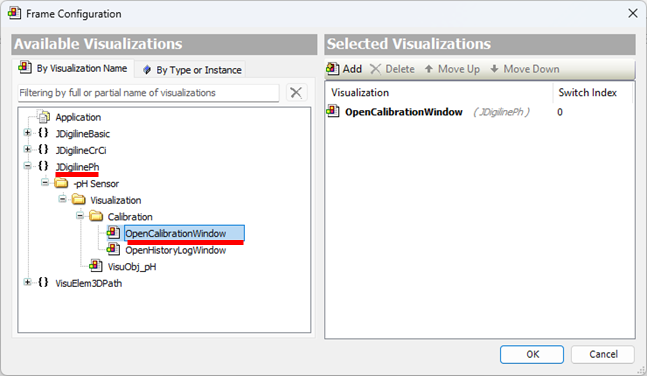
The button to start calibration is now first added.
In order to establish a relationship between the button and sensor, the pH sensor + suffix "_FB" must be selected under References.
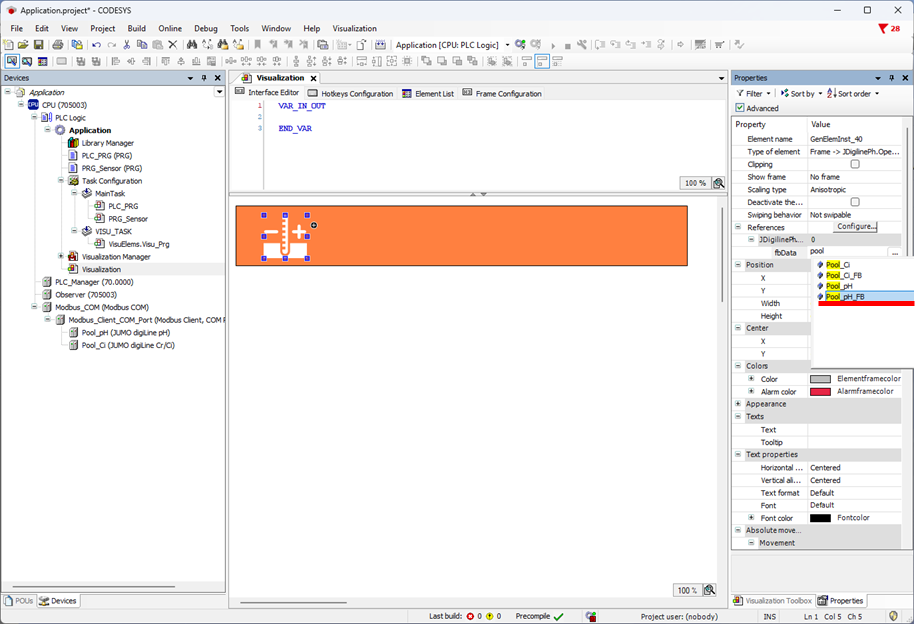
The same process is used for the button to call up the log book.
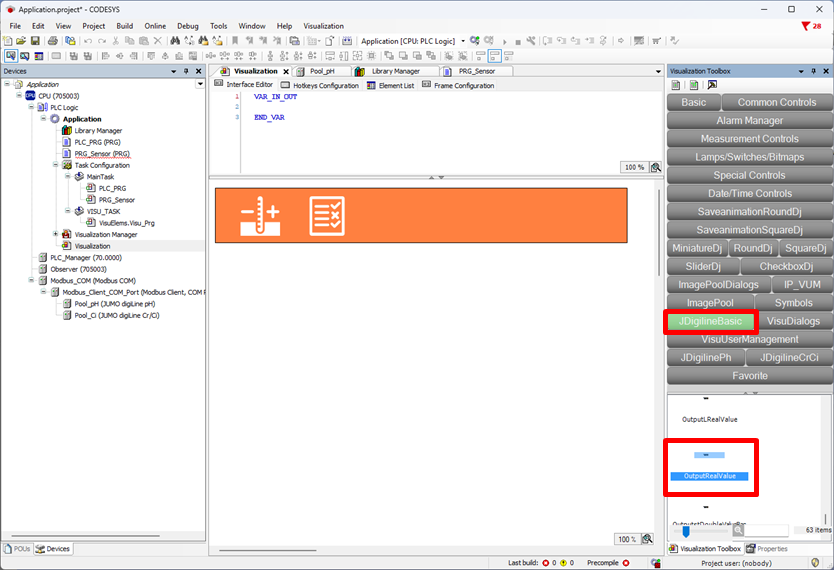
There are multiple ways to display the pH value. The OutputRealValue object from the JDigilineBasic is used in the following example.
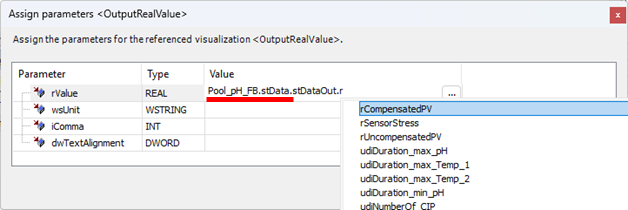
This object requires the following information to display the value correctly: value, unit, and decimal place. The sensor name <DeviceName>_FB.stData.stDataOut must be typed into the field for rValue. You then see a selection of possible variables.
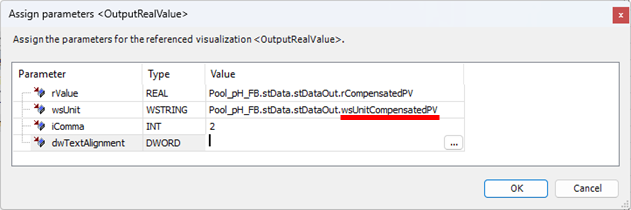
The unit includes the variable wsUnitCompensatedPV. If you want to show the value with two decimal places, input the value 2 for iComma.
When you transfer the project to variTRON, you can see the desired display of the value. The buttons can now also be used.
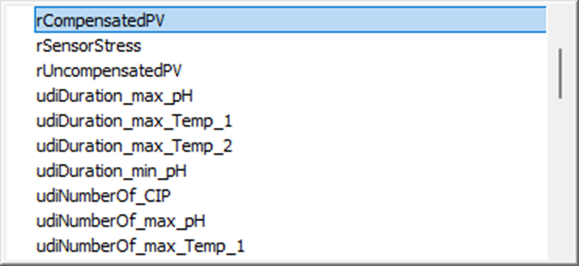
You can display much more information in your own object if you type in the following:
With <DeviceName>_FB.stData.stDataOut, you have a selection of potential sensor information.