
Use
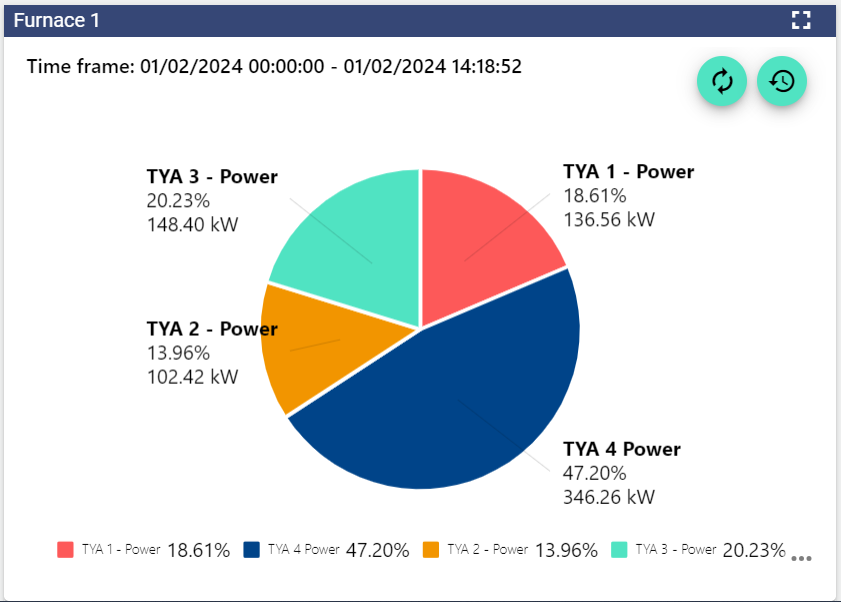
The Pie Chart widget shows in percentage terms how the individual signal values have behaved over the set period. To use a Pie Chart widget, you need an analog input signal.
|
|
Refreshes the historical view without performing a browser refresh. |
|---|---|
|
|
Open the “time control” area to analyse different time frames. |
Configuration
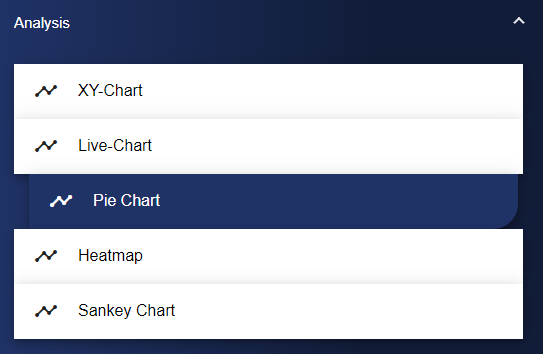
Select the Pie Chart widget in the Analysis category.
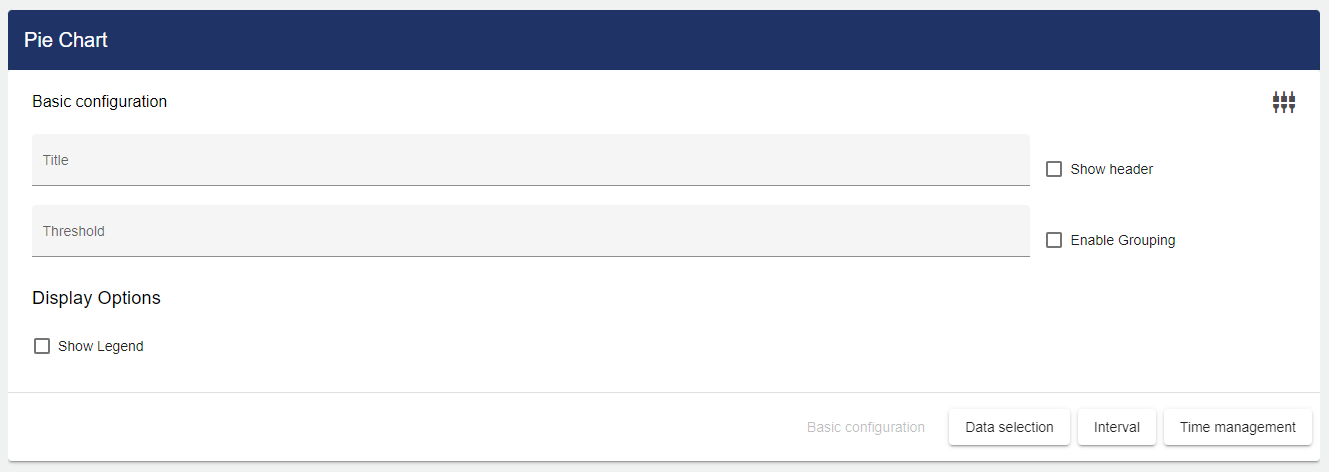
Adjust the pie chart via the Basic Configuration. First of all, assign a suitable title and a limit value to your pie chart. Limit values refer to groupings and define the value from which signals are grouped.
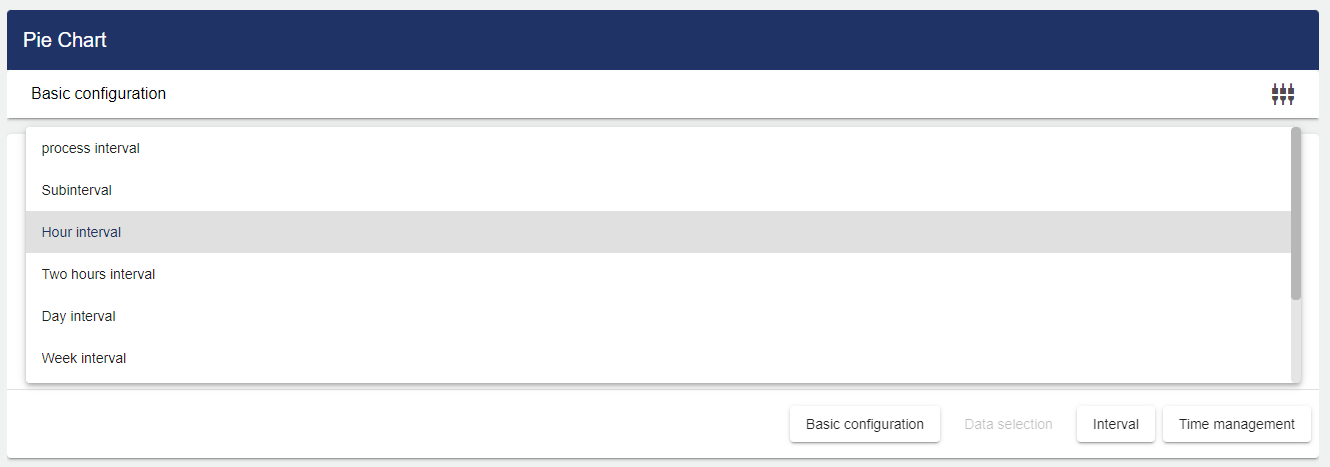
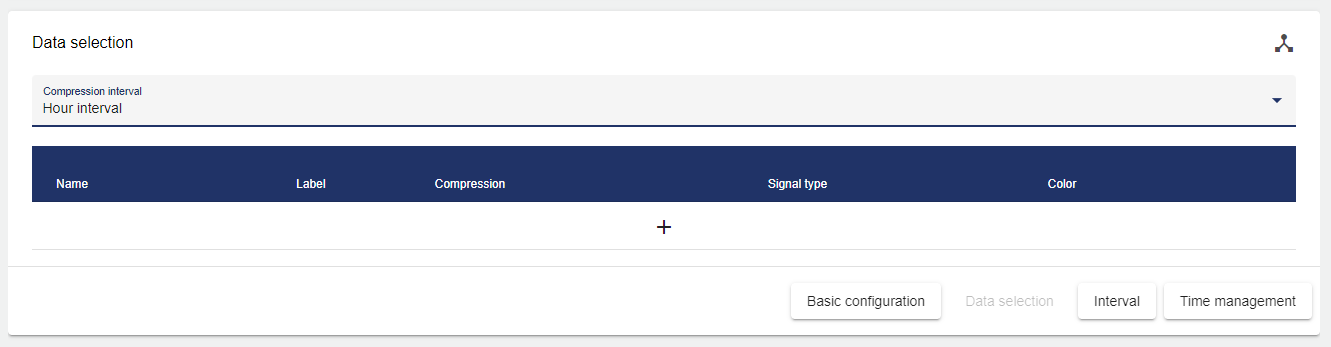
Then click the "Data Selection" tab. First you can select an interval type under the drop-down menu Compression Interval.
Click the Plus button to add signals to the list.
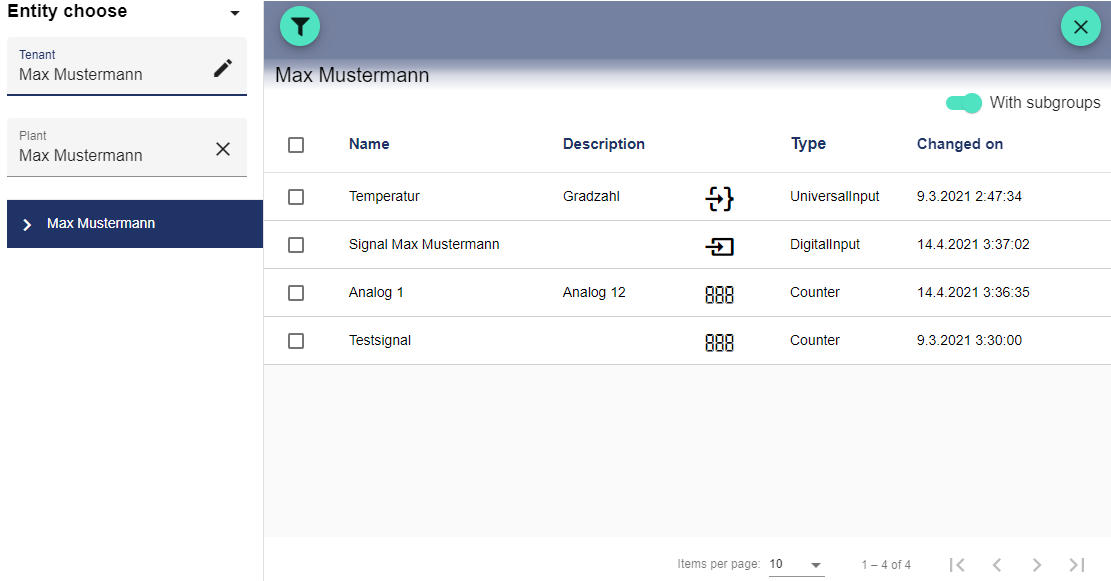
The Select Entity window opens. Now select the required signal by clicking the checkboxes.
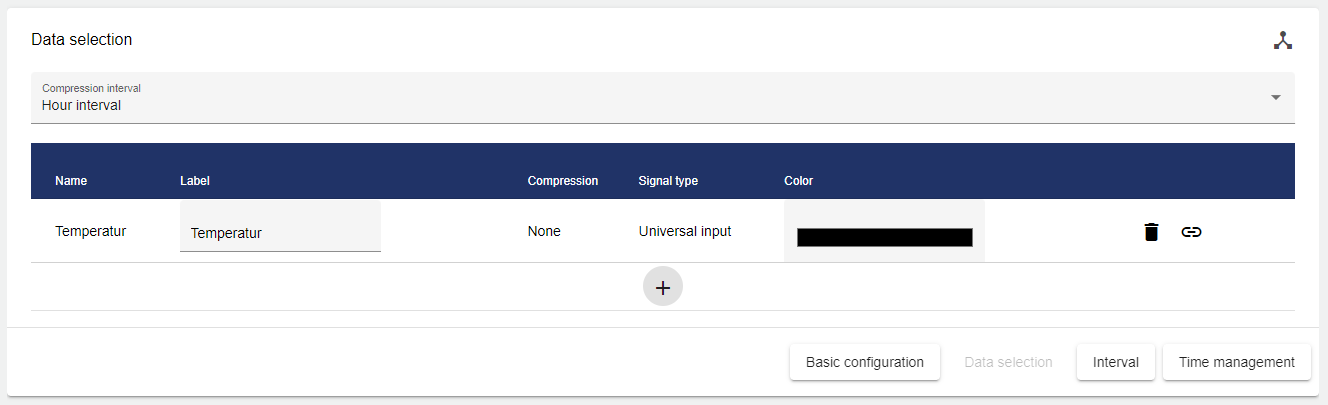
You can add more signals via the Plus button and then select the label and the color of the signal in the chart.
Now you only have to set the interval of the data to be displayed.
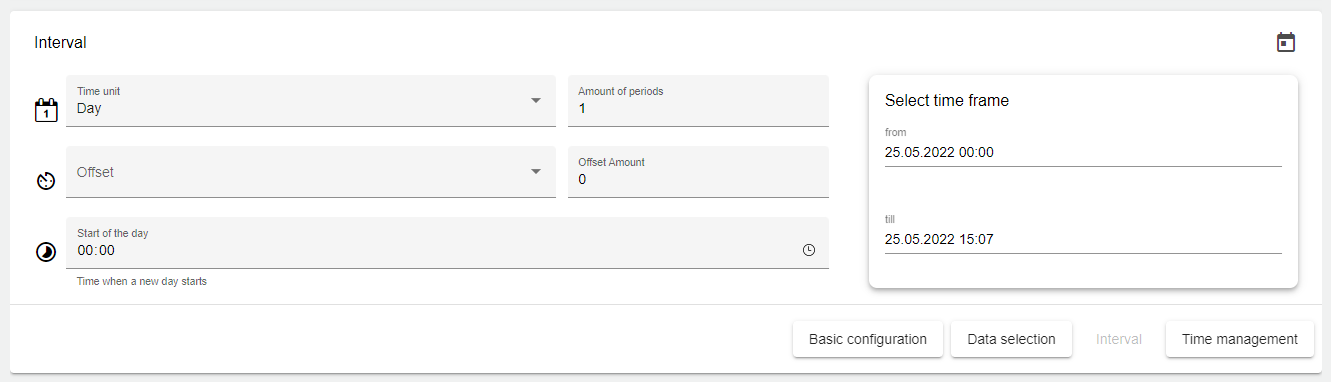
Set the time period for the display.
To display the data for one or more days, set the time frame to Day; the period number defines how many days in the past should be displayed. The same applies to any other time frame setting (week, month, quarter, year)!
|
|
Basic setting for the length of the interval. |
|
|
This setting can be used to change the starting point of the time frame. |
|
|
Offset. This setting can be used to specify an offset for the time frame. Both into the past and into the future. |
|
|
This setting can be used to specify the start of the day on an individual basis. |
|
|
This setting can be used to specify a particular day of the week as the start. (Only appears if "Week" was selected for the interval) |
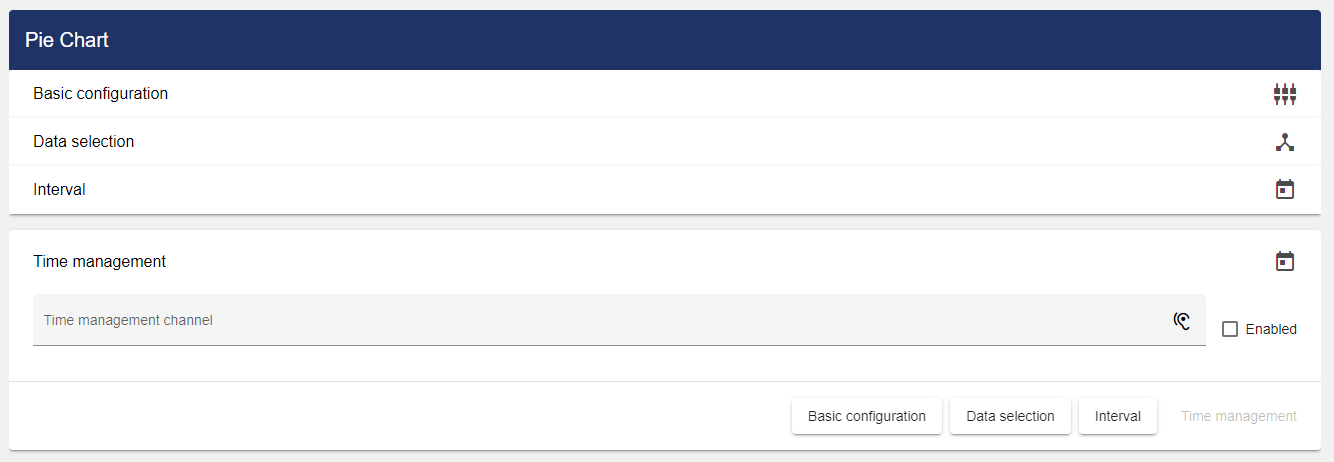
In the "Time Management" tab, you can specify different labels under "Channel" and use them to link multiple analysis widgets. This function is used, for example, if a viewer wants to see signal values at 9 am in all widgets of the Dashboard tab at the same time.
Finally, you can set a channel under the "Time Management" tab. First you need to assign a channel name. This channel name must be unique. The channel is used to link multiple charts on the Dashboard. This channel name can now be entered in multiple analysis widgets. By entering the same channel for different analysis widgets, the time periods of the different analysis widgets can be controlled simultaneously via the Dashboard.
Once you are satisfied with your configuration, you can save it.