Edit Dashboard
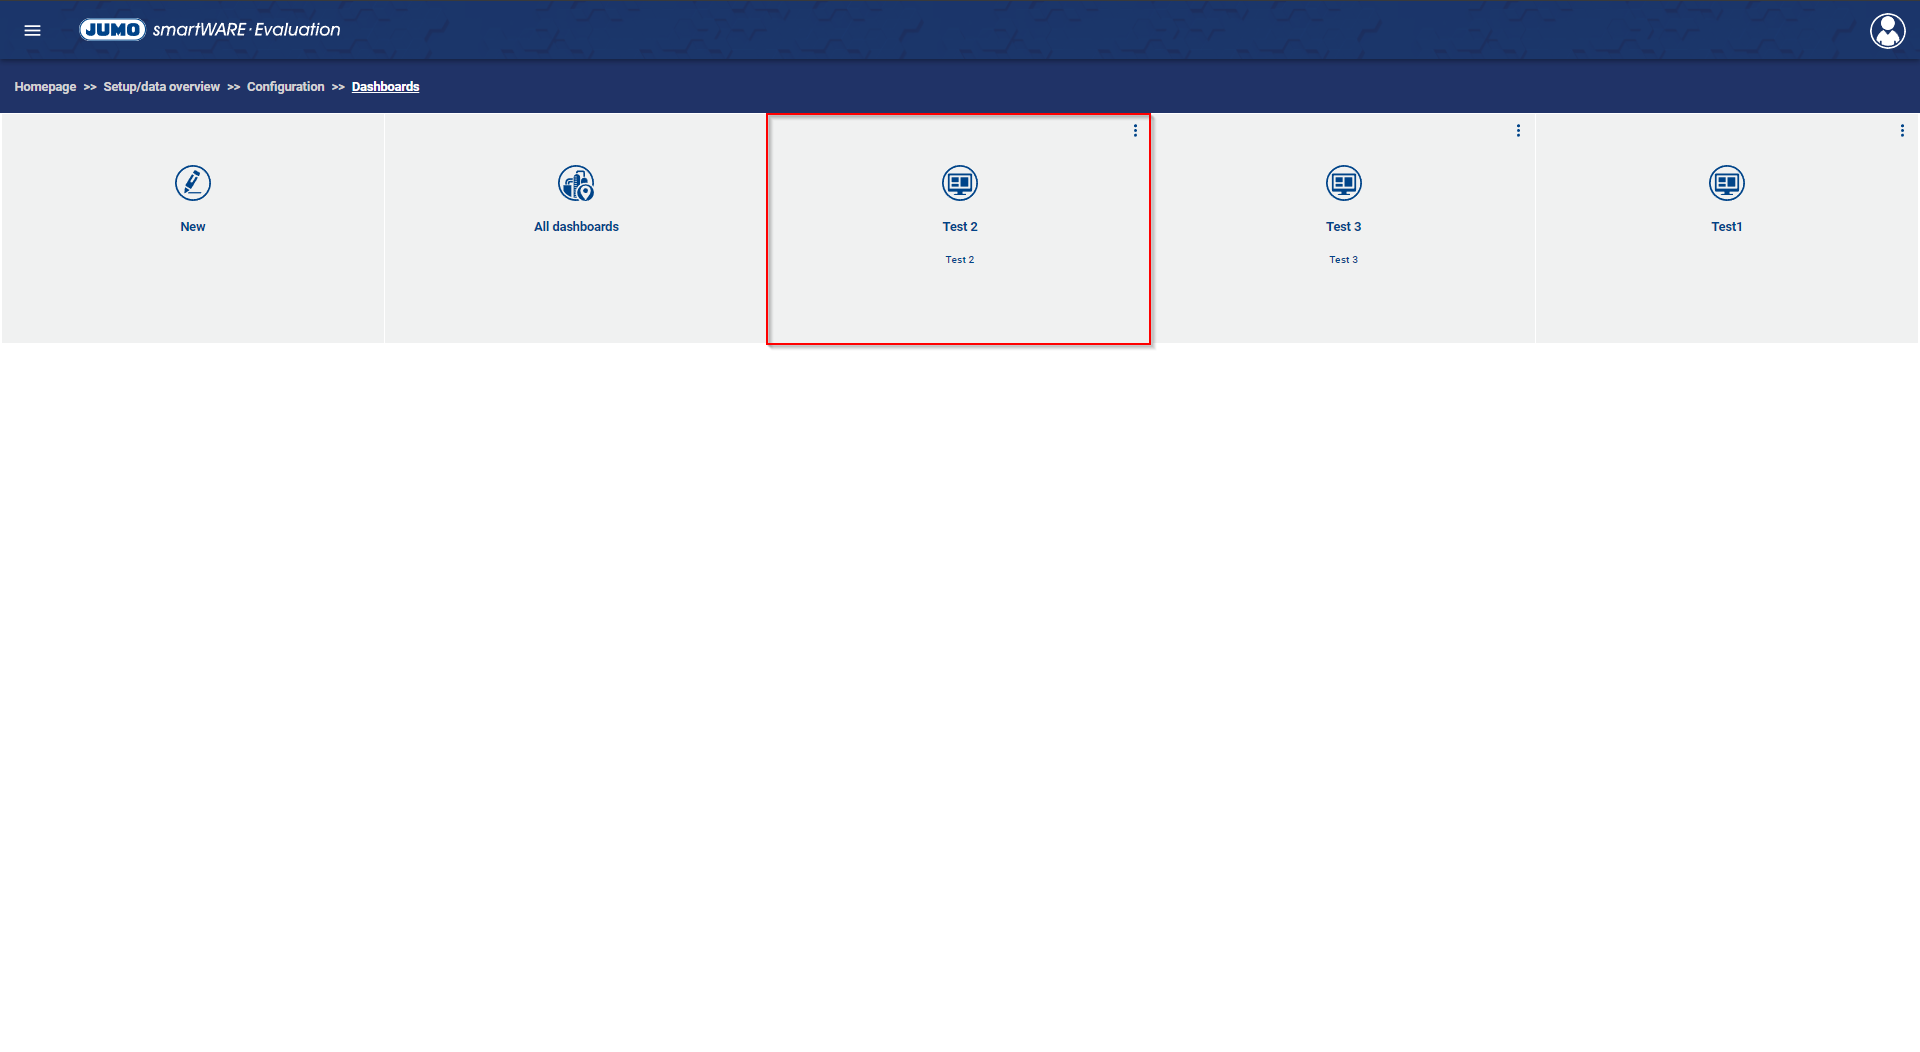
To edit an existing Dashboard, one of the existing Dashboards must be selected. The dashboard can be edited in four steps.
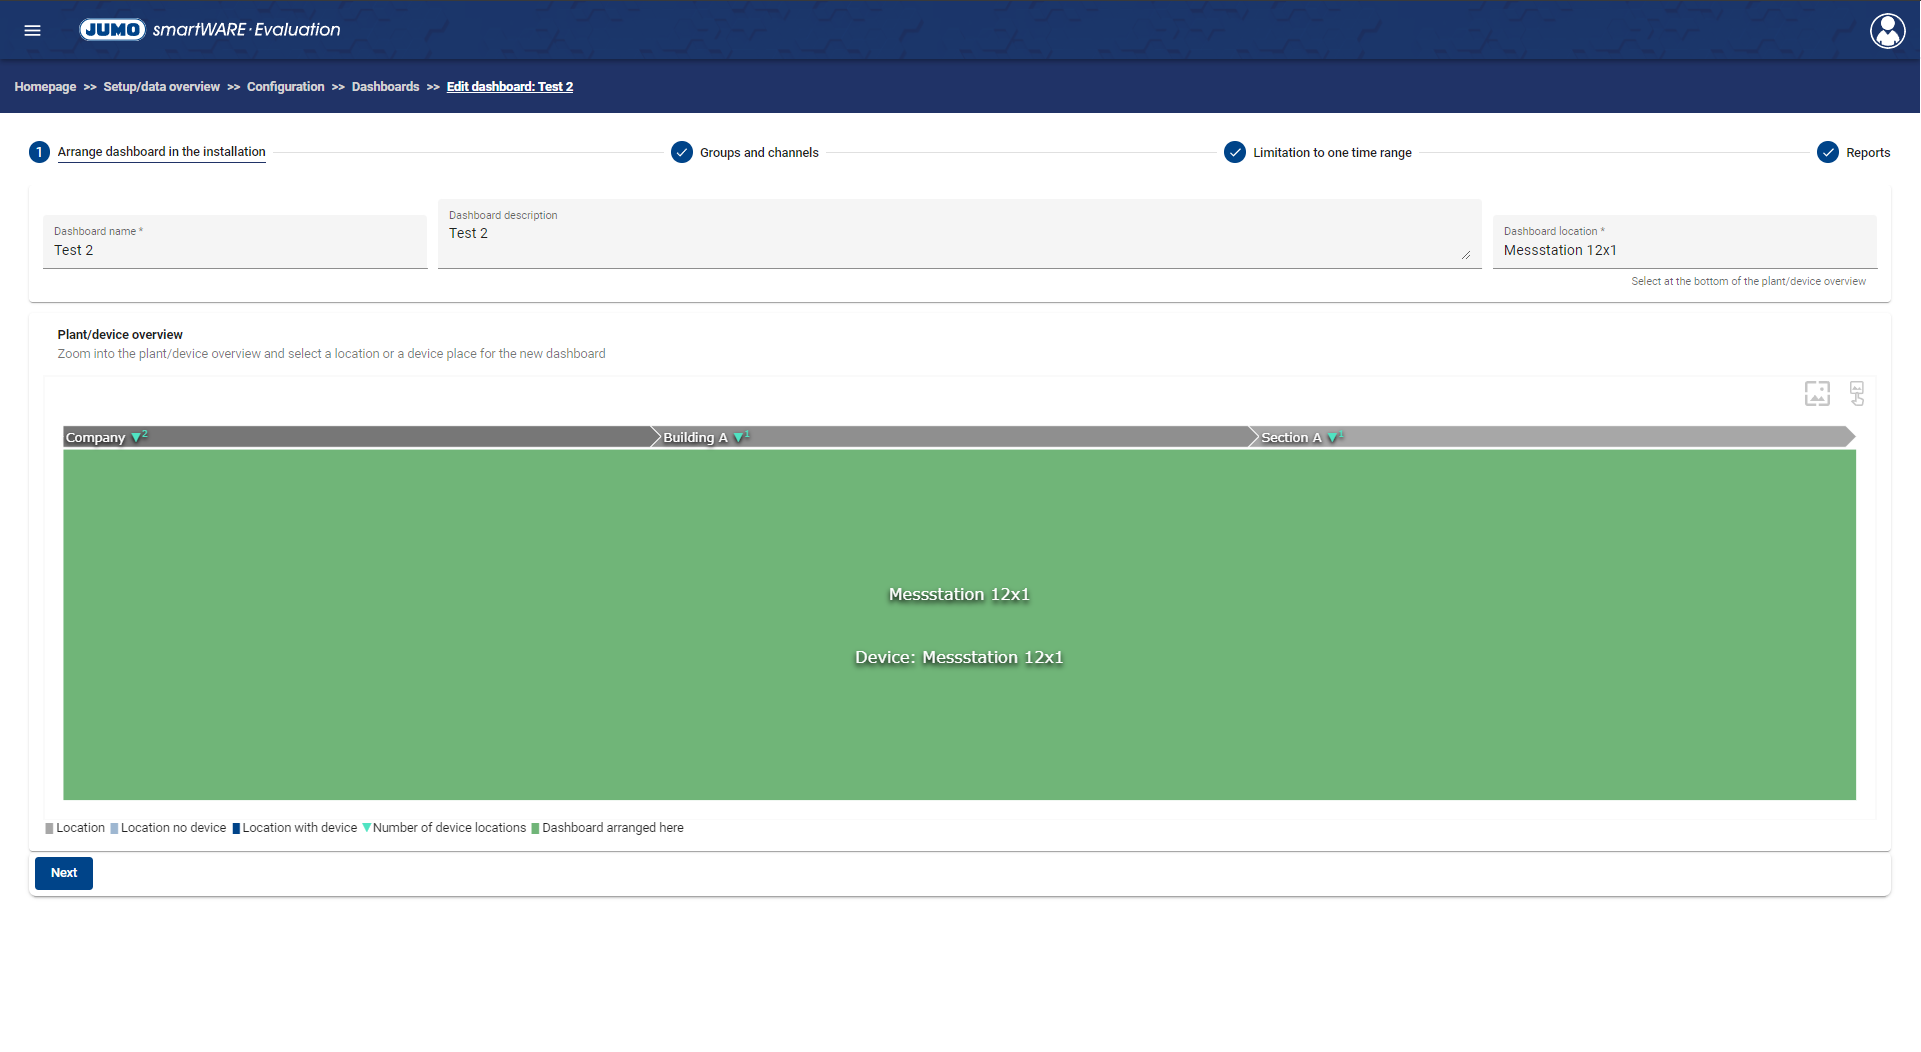
Arrange Dashboard in System
The following properties must now be defined:
Property | Meaning |
Name of the Dashboard | The name under which the Dashboard can be found again later is defined here |
Description of the Dashboard | A description for the Dashboard can be entered here |
Site of the Dashboard | The site/device location where the Dashboard is located is defined here. |
Clicking the "Next" button opens the next window.
There are two tabs on this screen:
Groups and Channels
Limitation to a Time Range
Groups and Channels
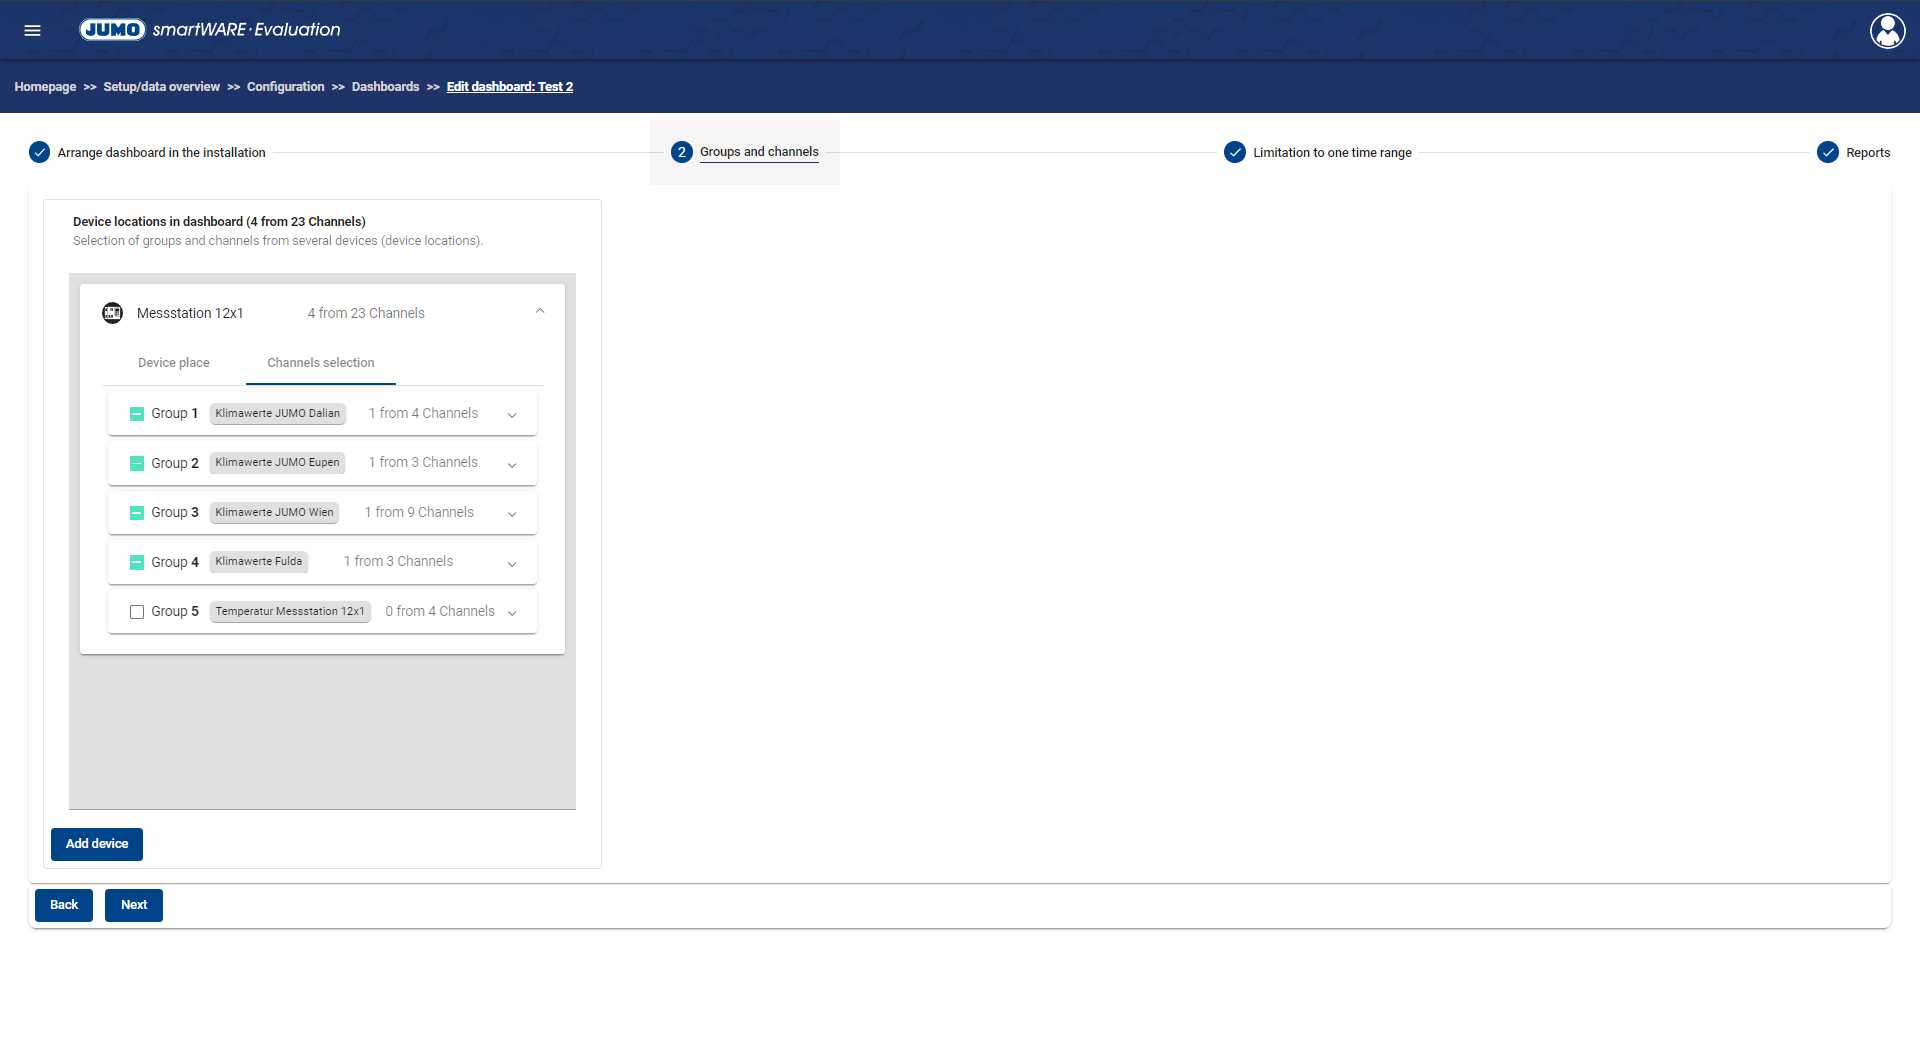
If a device location was selected as the site, the devices at the device location are automatically displayed on the left of the list. If a site was selected, the "Add Devices" button can be used to add another device to the Dashboard.
If a site was selected, all subordinate devices are not automatically displayed in the list. The devices must be added manually using the "Add Devices" button.
Each device in the list offers two tabs to configure the settings:
Device Location
Channel Selection
Setting | Description |
Device location | In this tab you can remove the selected device location from the Dashboard |
Channel Selection | In this tab, channels or channel groups to be displayed in the Dashboard can be selected for each device. |
Limitation to a Time Range
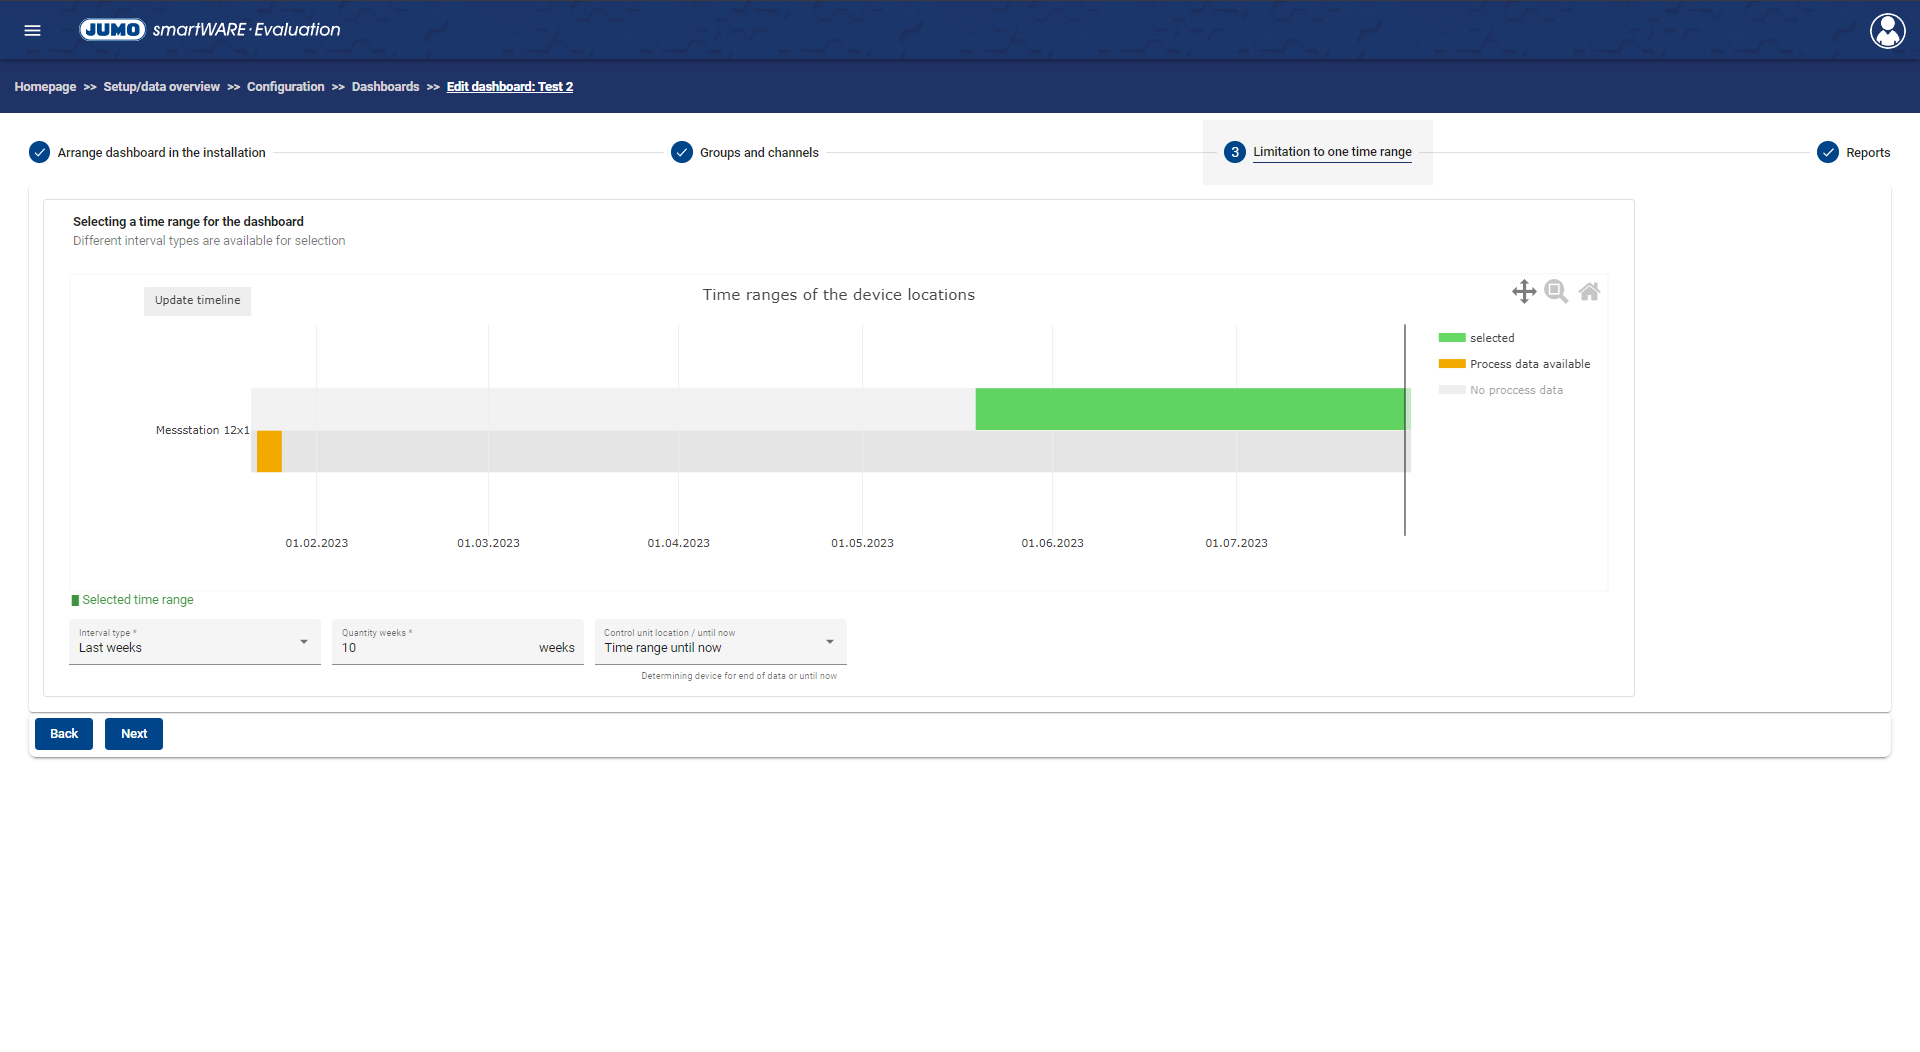
In order to define a time range for device locations, an interval must be defined. The following setting options for intervals are available:
Interval Type | Description |
Date from to | The start and end date of the interval can be set |
Date from | The start date of the interval can be set. The interval runs until the current time. |
Last hours | This setting allows you to define the number of hours by which the time range extends into the past. Here there is also the option to let the time range run until the end of the data of a device or until now, i.e. the current time. |
Last days | This setting allows you to define the number of days by which the time range extends into the past. Here there is also the option to let the time range run until the end of the data of a device or until now, i.e. the current time. |
Last weeks | This setting allows you to define the number of weeks by which the time range extends into the past. Here there is also the option to let the time range run until the end of the data of a device or until now, i.e. the current time. |
Last months | This setting allows you to define the number of months by which the time range extends into the past. Here there is also the option to let the time range run until the end of the data of a device or until now, i.e. the current time. |
Last years | This setting allows you to define the number of years by which the time range extends into the past. Here there is also the option to let the time range run until the end of the data of a device or until now, i.e. the current time. |
Example for option "until end of data":
The setting "8 hours to end of data" means that the last 8 hours of data sent by a device are available as Warm Data and can be evaluated. This is also the case if the last data transmission was several hours ago.
Reports
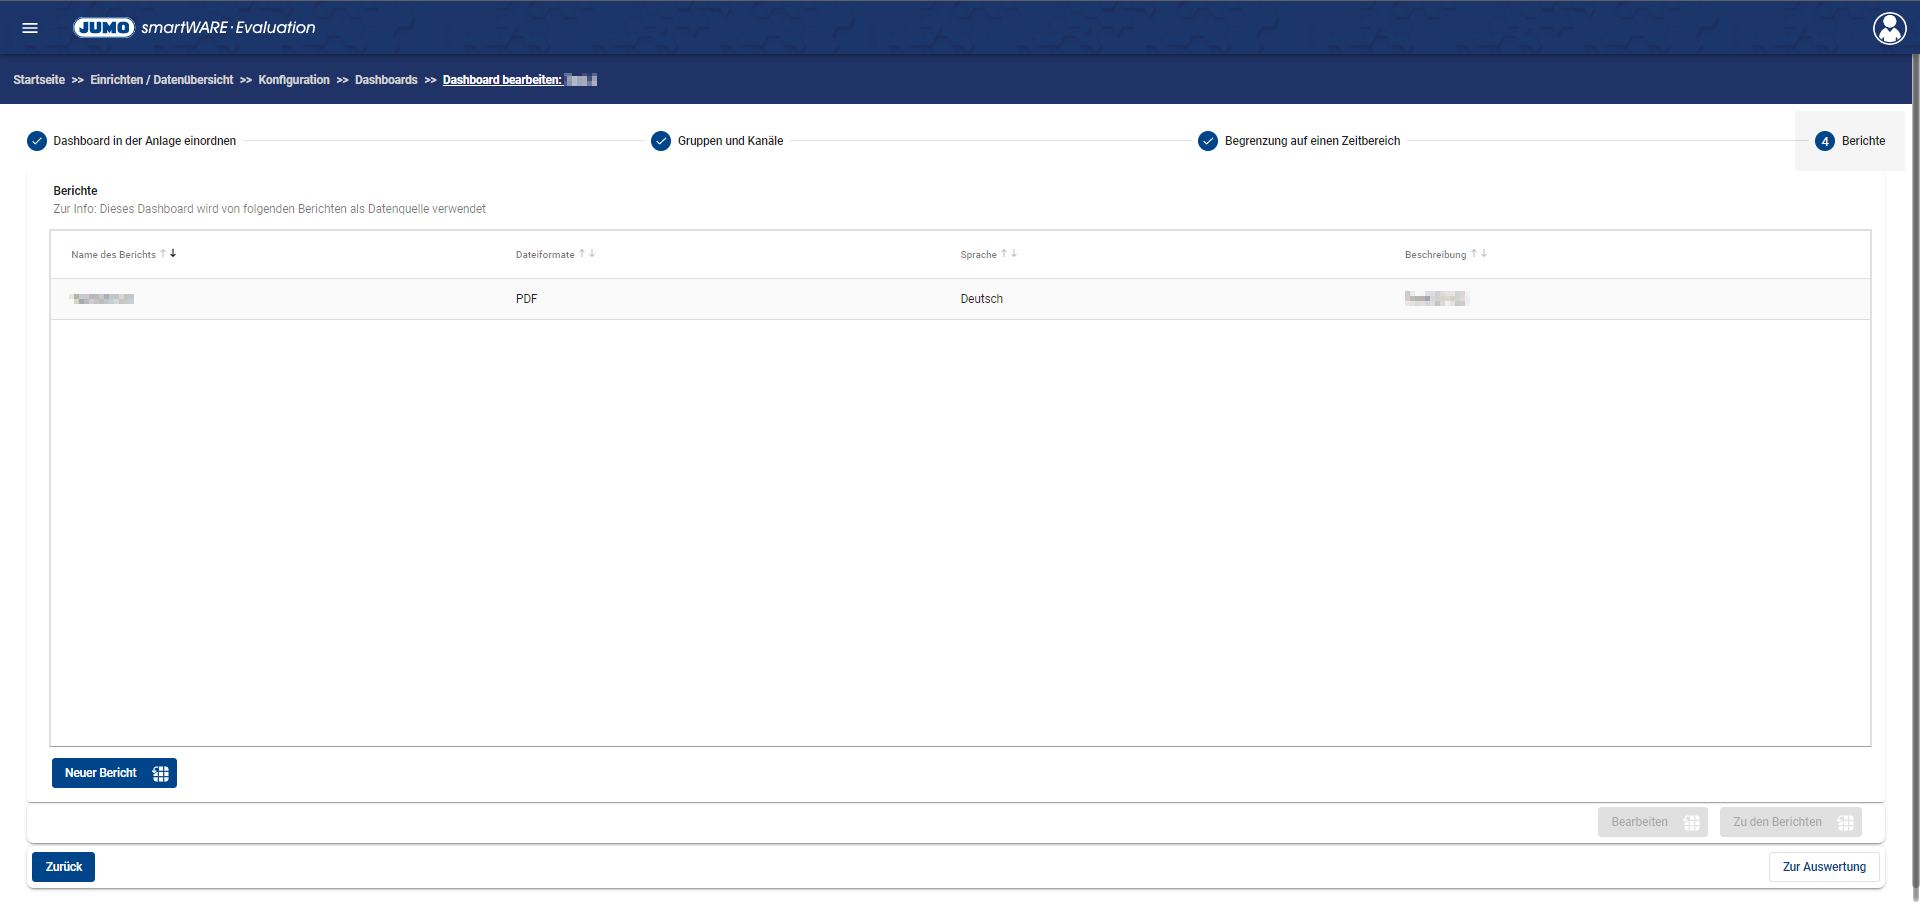
This window displays the reports based on the currently edited dashboard. You can also click on the button "New report" to New report created be added. If a report has been selected, it can be adapted via the "Edit" button. Clicking on "Go to the reports" will bring you to the evaluation area Reports.
Clicking the button "To the Evaluation" opens the Evaluation of the created Dashboard.
