
How do I prepare a report?
To create a Report, you must first navigate to the pane Reports. There you can click on New on new report are created.
Step 1 “Data source report template”:
The first step is to define the basic configurations of the report.
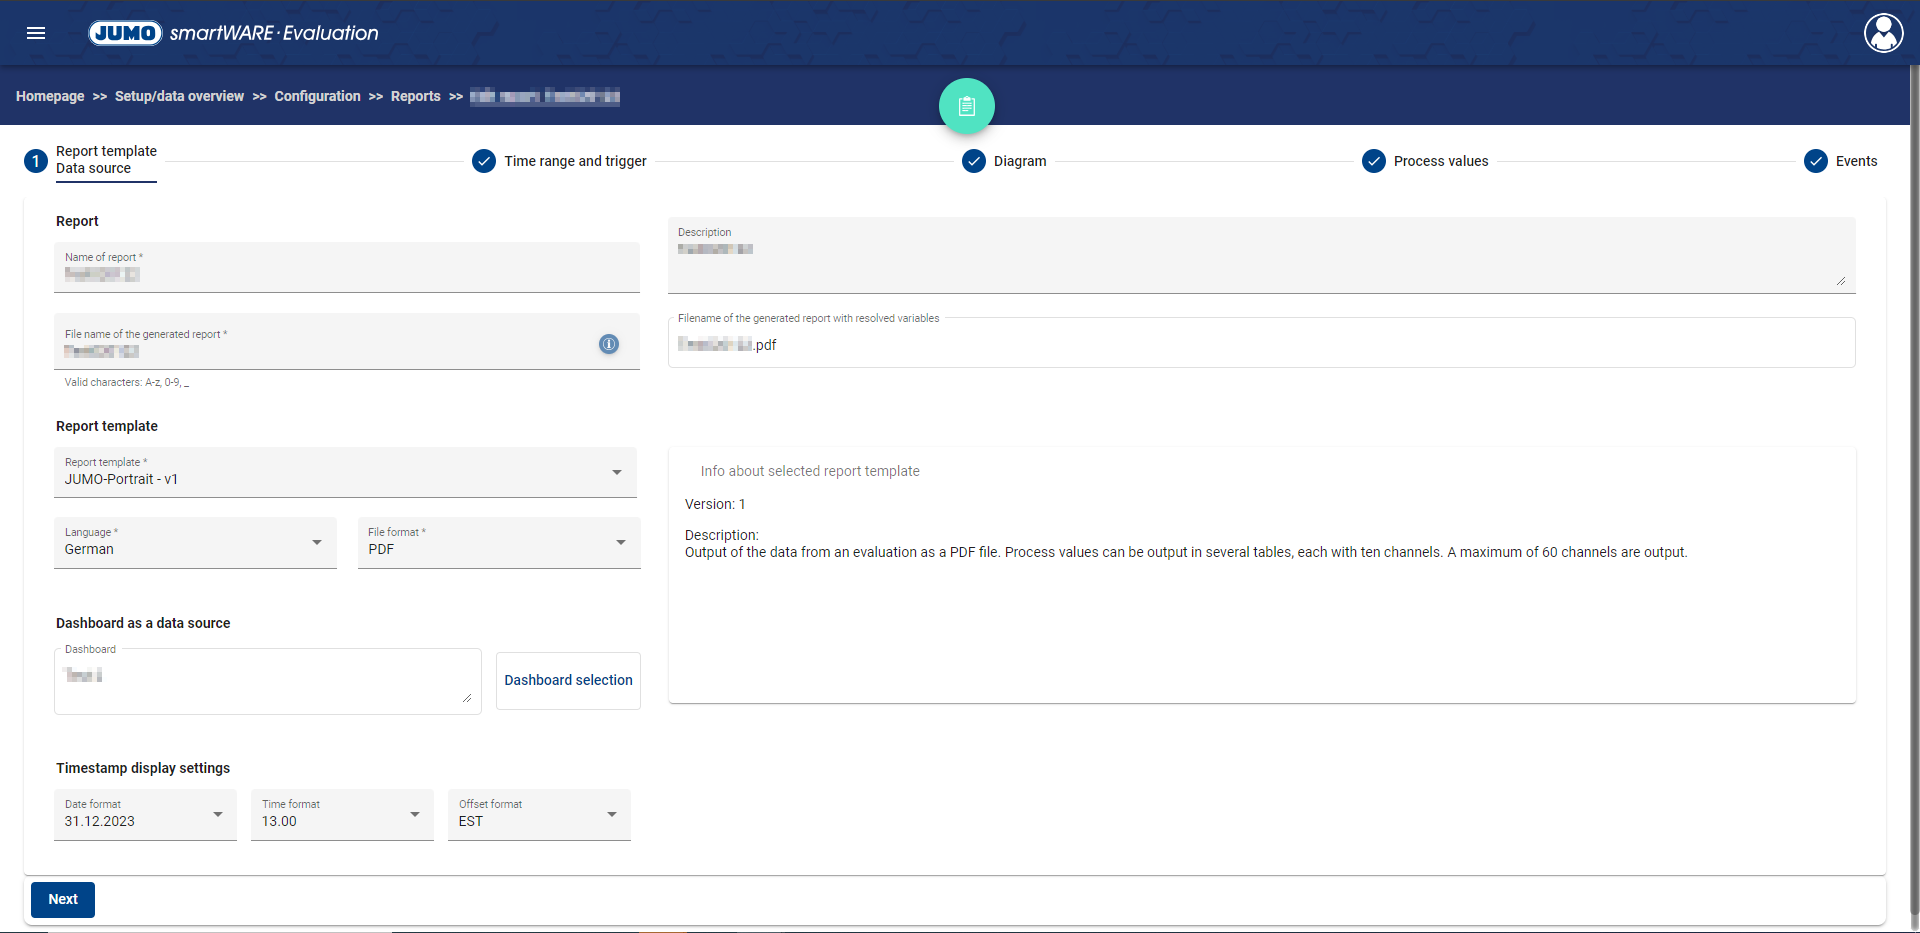
Report
Function | Description |
|---|---|
Report Name | Name of the report in the JUMO smartWARE Evaluation |
Description | A description can be stored here. It can be used to make different reports distinguishable from one another. |
Filename of the generated report | Report file name on download Right: Preview with resolved variables |
Report template
Function | Description |
|---|---|
Report template | Select the report template to use for the report |
Language | The language of the report can be selected here. When you create the report template, you determine which languages are available for each template. |
File format | Here you can select the report file format. When the report template is created, it determines which file formats are available for that template. |
Dashboard as Data Source
This selects the dashboard that will appear in the report. To do this, the Dashboard Selection button opens the Device/Plant Overview where the desired dashboard can be navigated as usual.
Timestamp Display Settings
The following settings can be made here:
Date format
Time format
offset format
+5
+05:00
EST
Step 2 “Time Range and Trigger”:
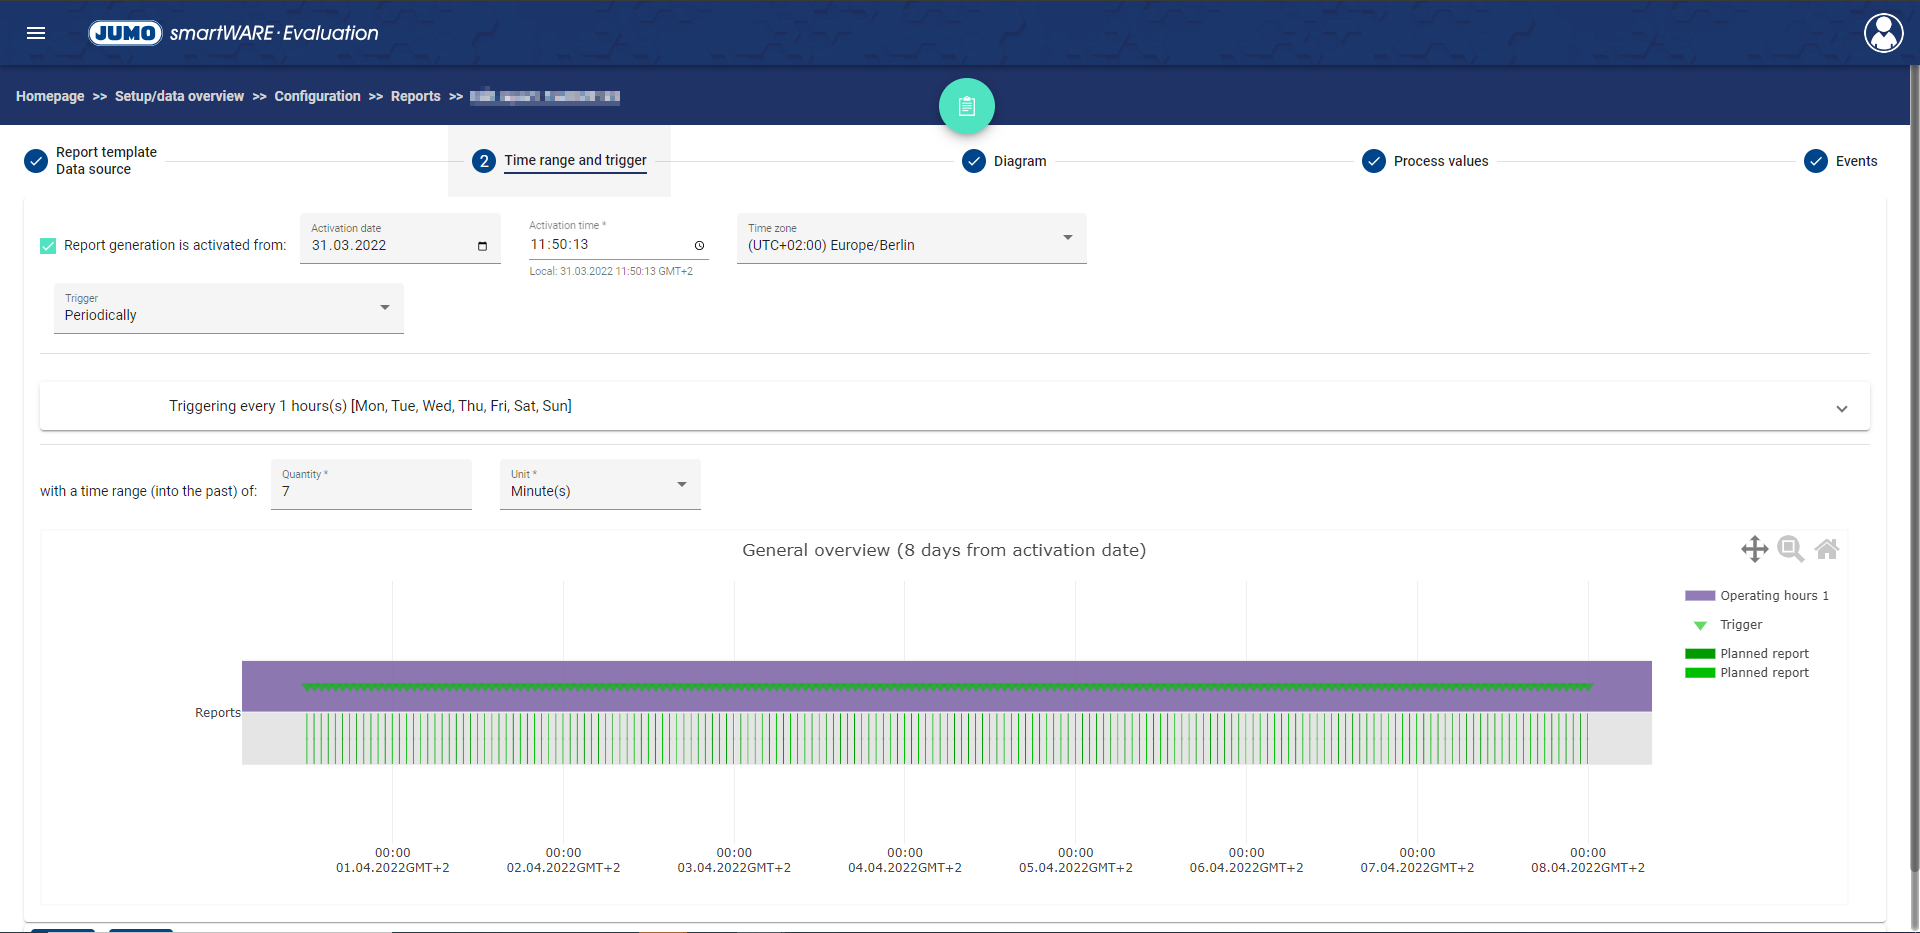
Time range and triggering
Here you can enable or disable reporting. The report is then generated automatically after the following settings are made:
Function | Description |
|---|---|
Activation date | Date from which reporting is active. |
Activation time | Time from which reporting is active. |
Time zone | For times of day (e.g. operating hours), the set time zone applies |
Trigger | Use this field to determine the trigger. |
There are several triggers:
Trigger | Description | Choices |
|---|---|---|
Periodic | Here you can define periods and intervals in which the reports are triggered. This applies within the defined operating times. | |
Time | A specific time can be selected here. |
|
Event Triggers | Here you can define triggers per event. The event is freely selectable. |
|
Start / End Event | Definition of start/end events. | |
Batch | A batch configuration can be uploaded here. Each completed batch generates a report. |
For the triggers Time and Periodic a preview is available at the bottom of the window.
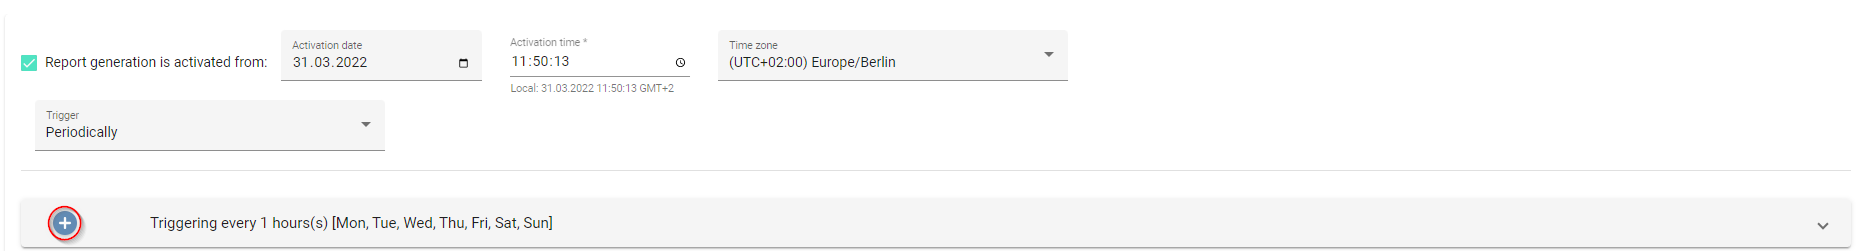
By clicking on the + you can add further blocks with conditions for the triggering.
Step 3 “Diagram”:
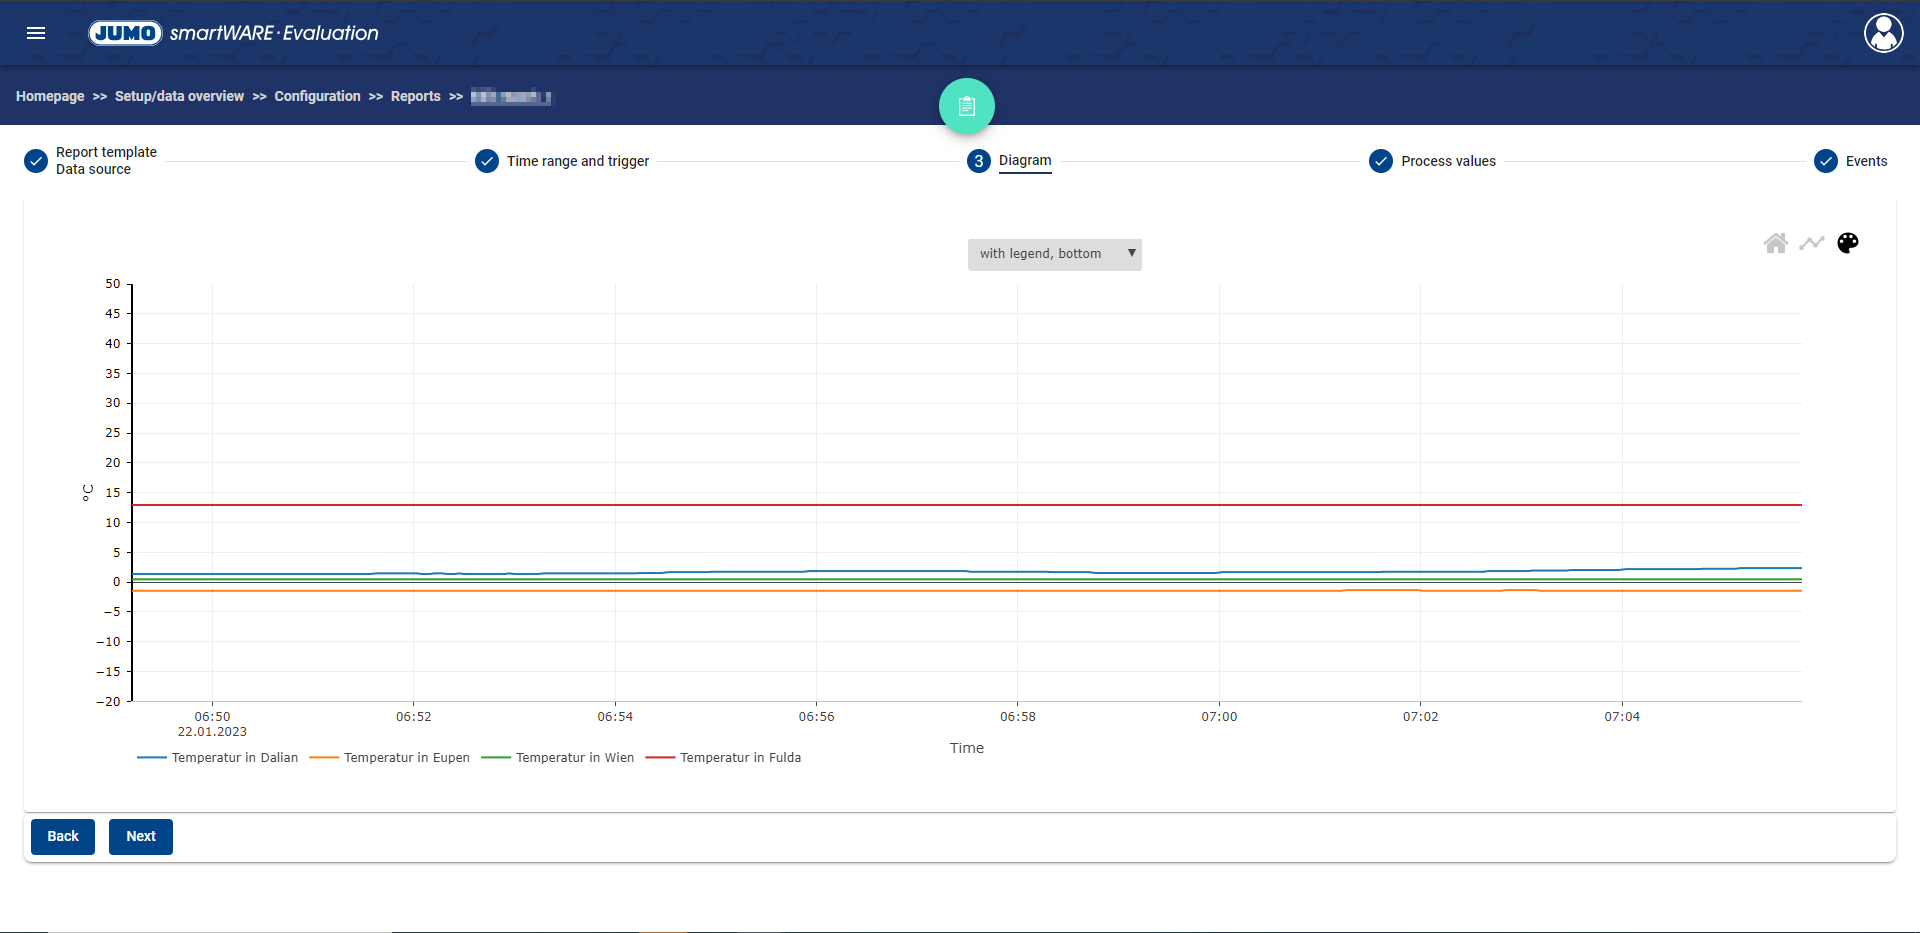
In the third step diagrams different scales can be selected for the diagram. There is also the possibility to reposition the legend or disable it.
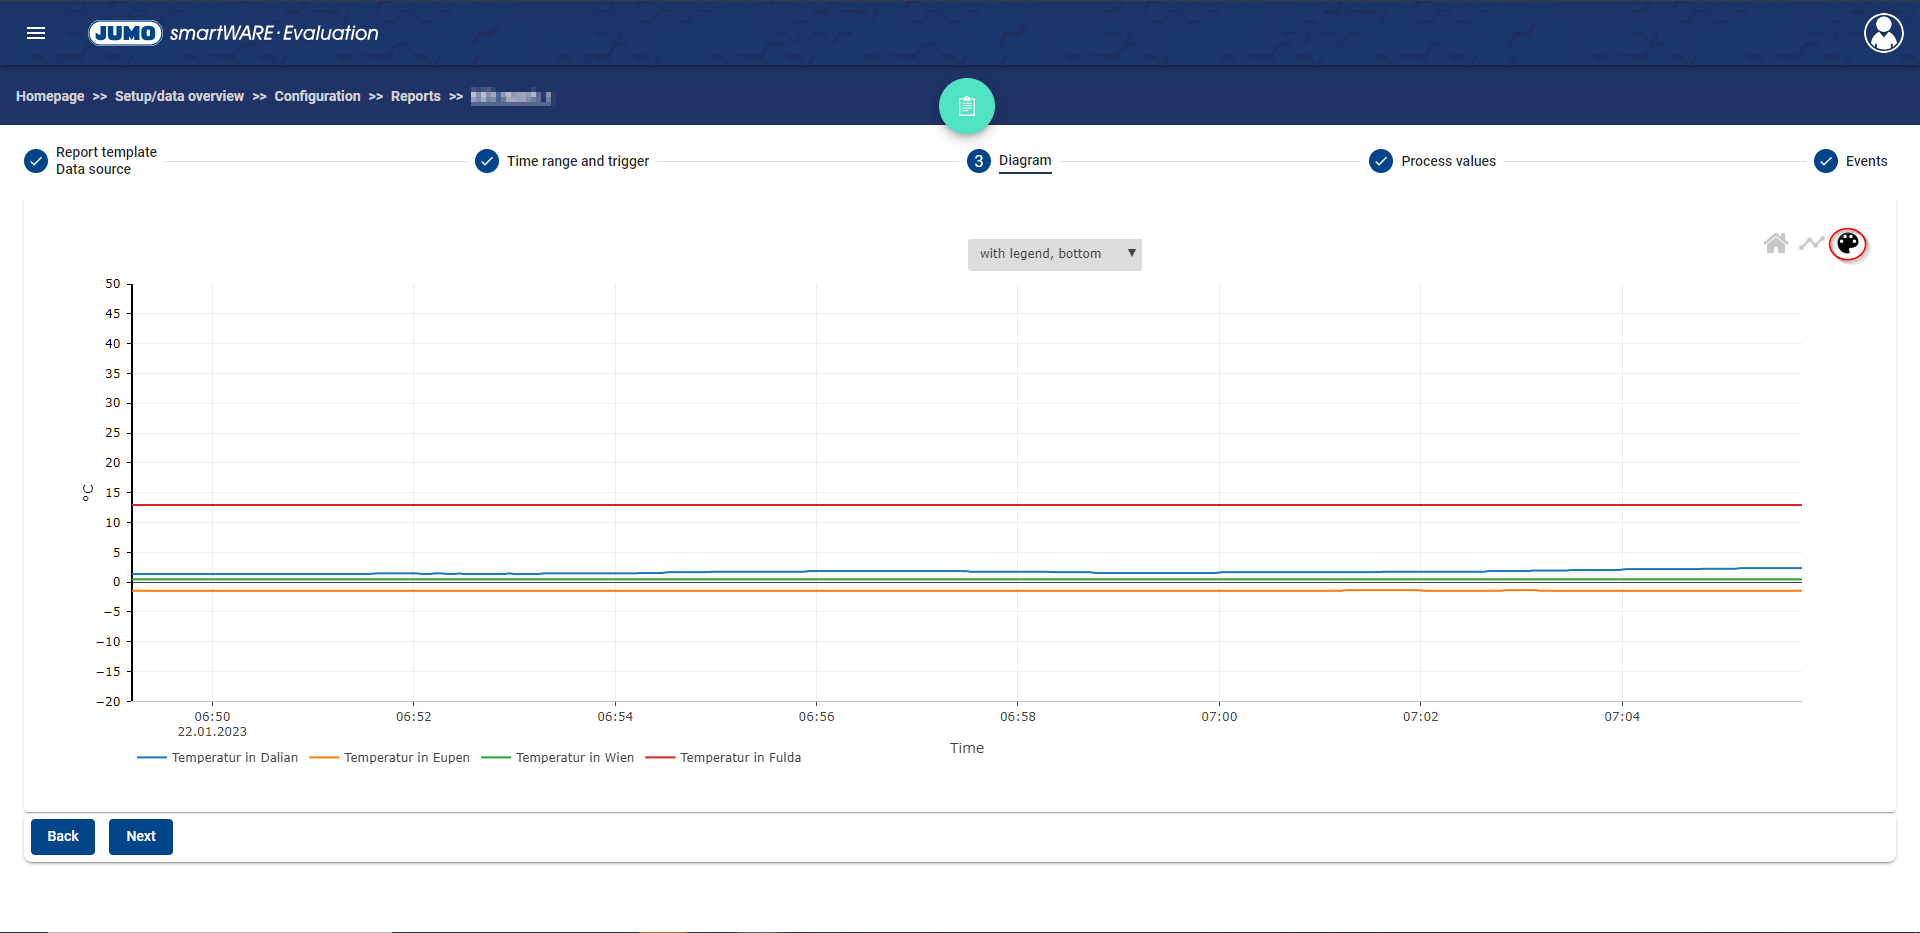
Clicking on the color palette icon opens a window where you can Chart Presentation customize the.
Step 4 “Process Values”:
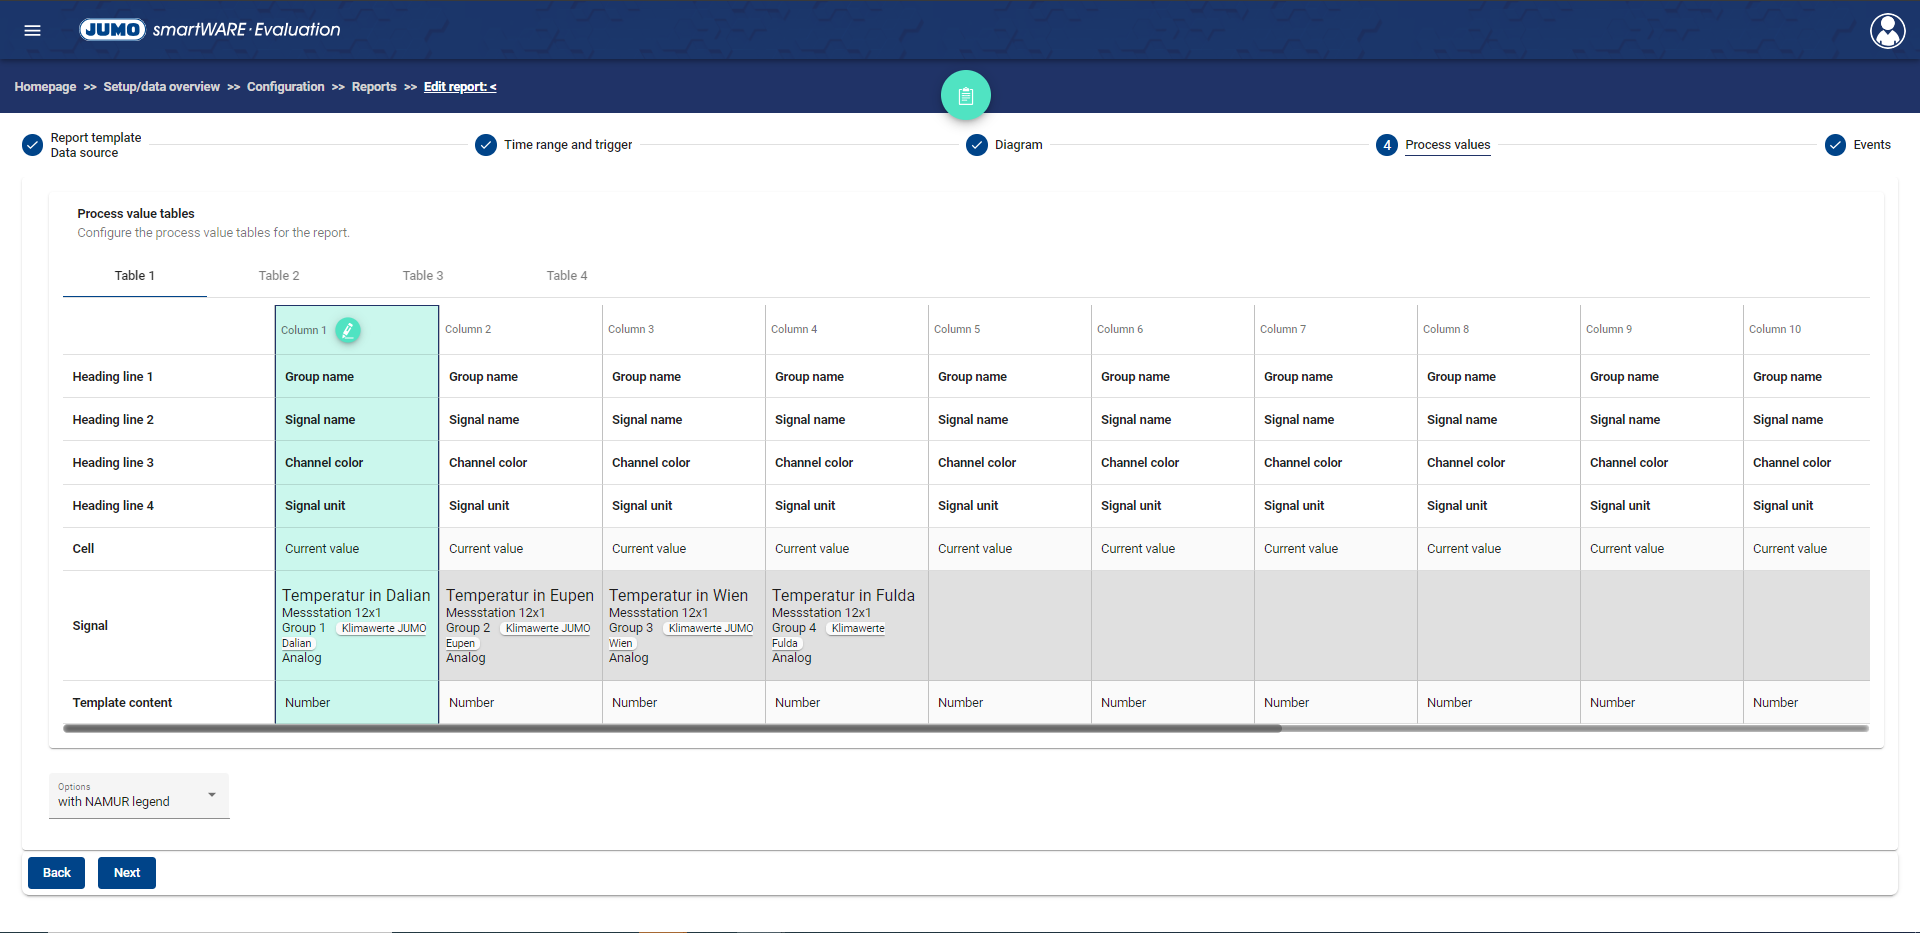
The Process Values step can be used to define an individual process value table.
Click the + in the table area to add a new table to the report. Clicking the Delete button deletes the selected table.
The columns per table can be individually designed. As you move your mouse over a column, the options for the selected column appear. A new column can be inserted next to the selected one, and the selected column can be deleted or changed.
Clicking on Change Column opens a new window.
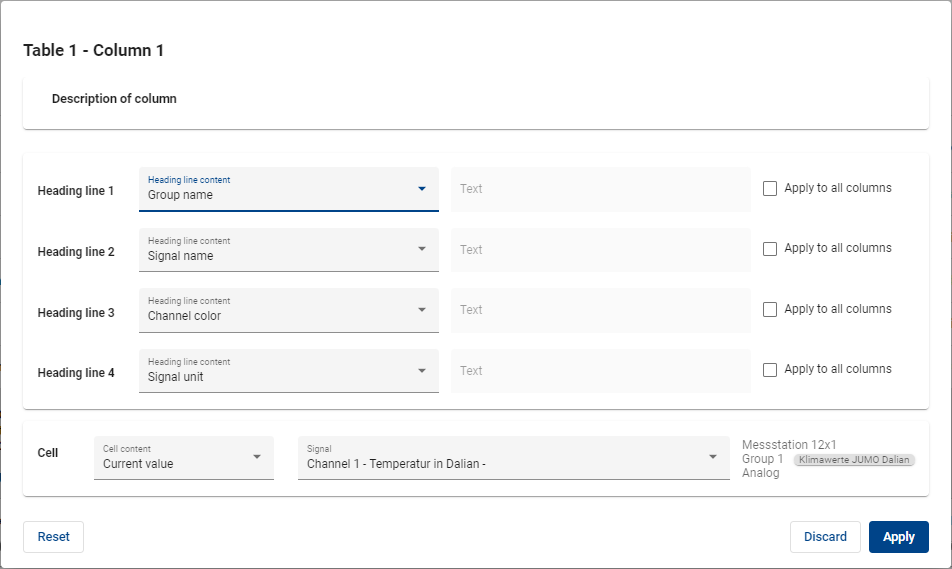
This window allows you to define the various columns. A description for the column can be added at the top of the window.
Clicking Apply to All Columns changes the header row to all columns in the current table.
In the middle of the window, the header columns are defined. Here you can:
Free text
Device location name
Manufacturing number of the device
Group Name
Signal name
Signal unit
Channel color
Cell content
During Free Text Entry, the text field in the window is enabled for the selected header. There, the free text input can take place.
Behind each header is the ability to apply the selected content to all columns.
In the lower part of the window you can define the contents of the cell.
By clicking on the Default Content drop-down menu, the contents of the cell can be restricted in advance. The following restriction options are available:
Function | Description |
|---|---|
No restriction | No restrictions on cell content field |
Number | The contents Current value, Mean value, Min value, and Max value can be selected in the Cell content field. |
Current value | Only Current value can be selected for the Content Cell field |
Average value | Only an average value can be selected for the Content Cell field |
Min. value | Only Min value can be selected for the Content Cell field |
Max. value | Only the Max value can be selected for the Content Cell field |
Unit | Only unit can be selected for the Content Cell field |
Timestamp offset | Only timestamp offset can be selected for the Content Cell field |
Clicking Apply applies the saved settings.
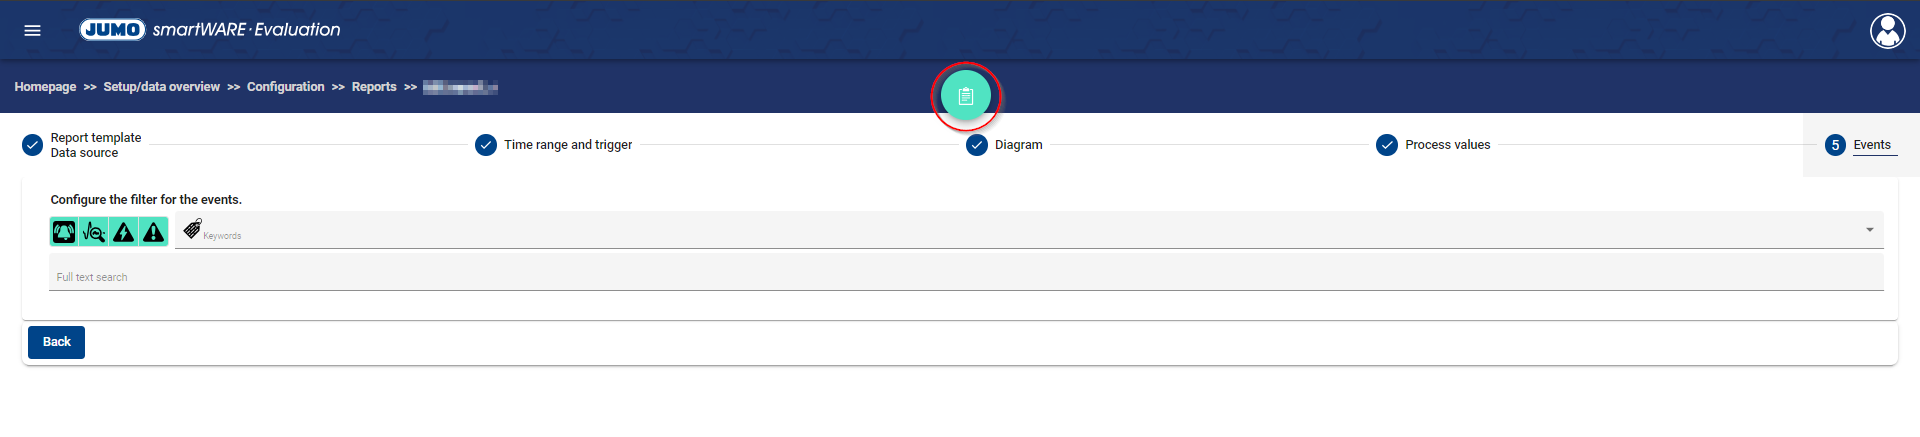
Step 5 “Events”:
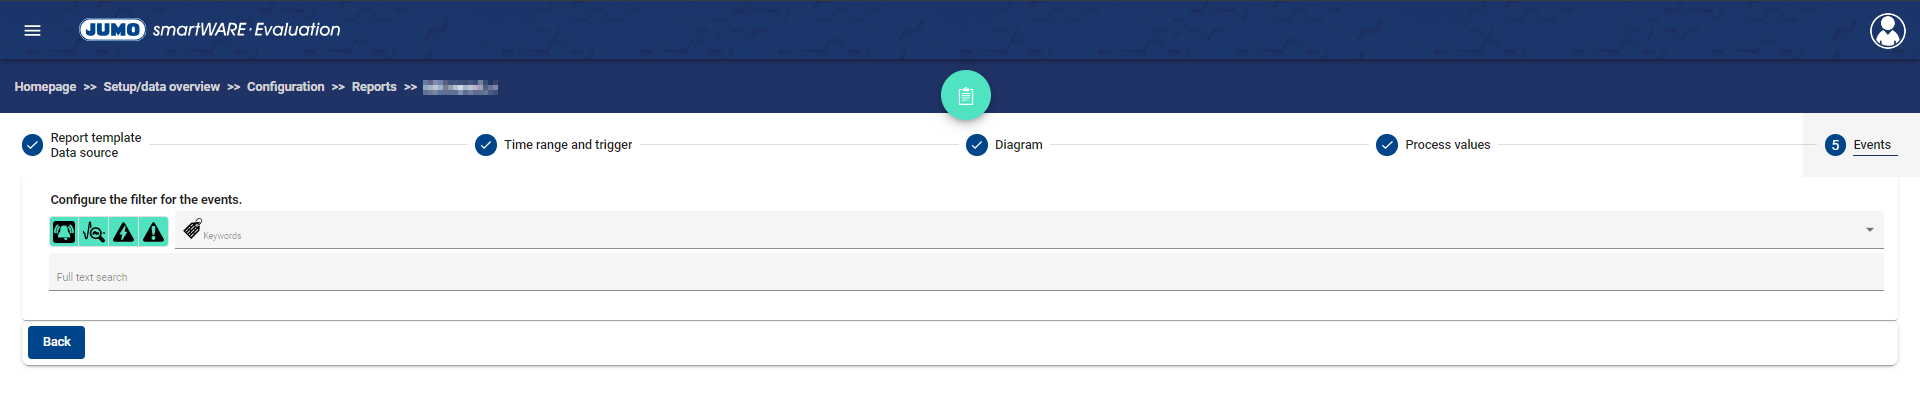
You can filter by events in this window.
Other Functions
At the top of the page are three options:
Test report
A test report can be generated here.
Create Test Report
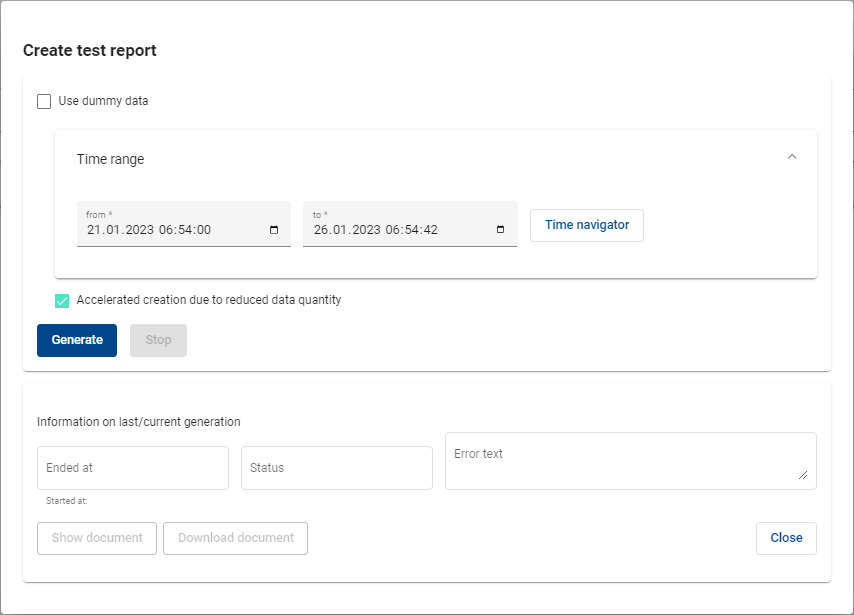
The time frame to be shown can be adjusted in the upper section of the window.
By clicking on the checkbox use test data, the test data stored in the system is used to generate the test report.
Lot Trigger
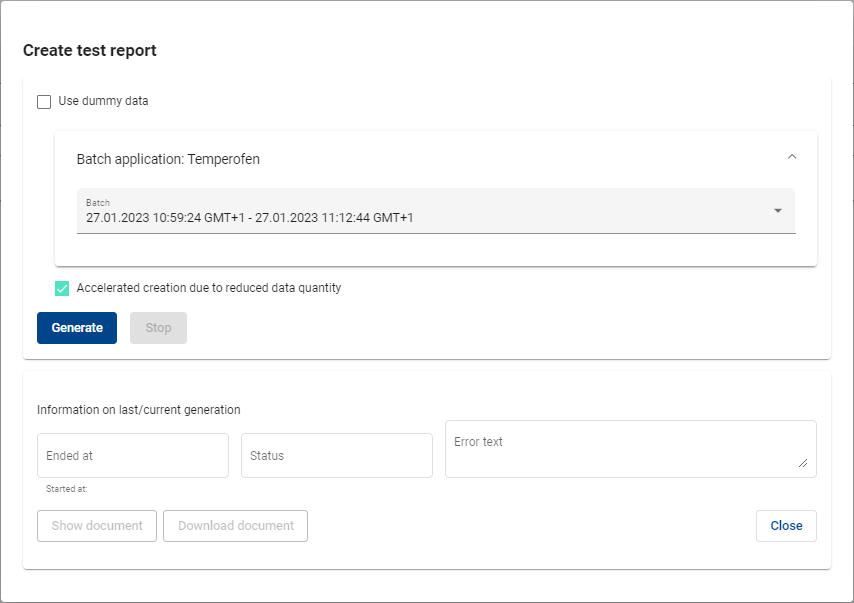
If Charge from Trigger has been selected, the top window will look something different. The batch application is displayed. You can also select a batch instead of selecting the time range.
In the middle of the window there are two buttons:
Function | Description |
|---|---|
Create | Starts the test report build process |
Stop | Stops the process of generating a test report |
The bottom of the window displays information about the current or last creation.
Information | Description | Choices |
|---|---|---|
Finished at | Time when the build was finished | |
State | Specifies the status of the build |
|
Error text | If the status indicates an error, there is an error text | |
View Document | Test report document opens in the browser in use in a new tab | |
Download Document | Test report document is downloaded in the browser used in the previously selected format. | |
Close | Closes test report windows |
Save
The edited status is saved for the selected report.
Cancel Change
The edited stand is discarded. The contents from the last memory level are displayed when you open it again.