4.15 Update from
JUMO smartWARE SCADA Software Update
1.) With the new Widget: Traffic light, system statuses can be recognized and interpreted at a glance. The traffic light colors light up or flash depending on the signal condition or event.
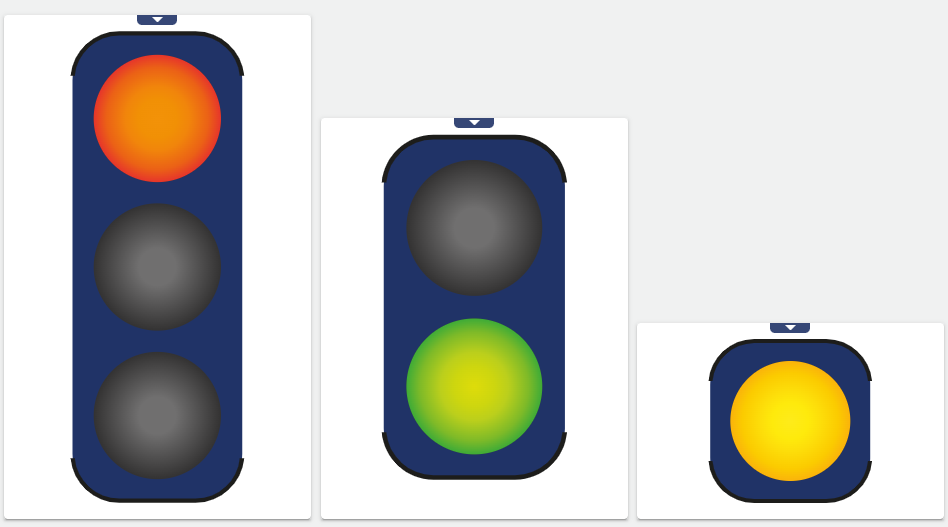
2.) New functions have been added to Widget: XY-Chart:
-
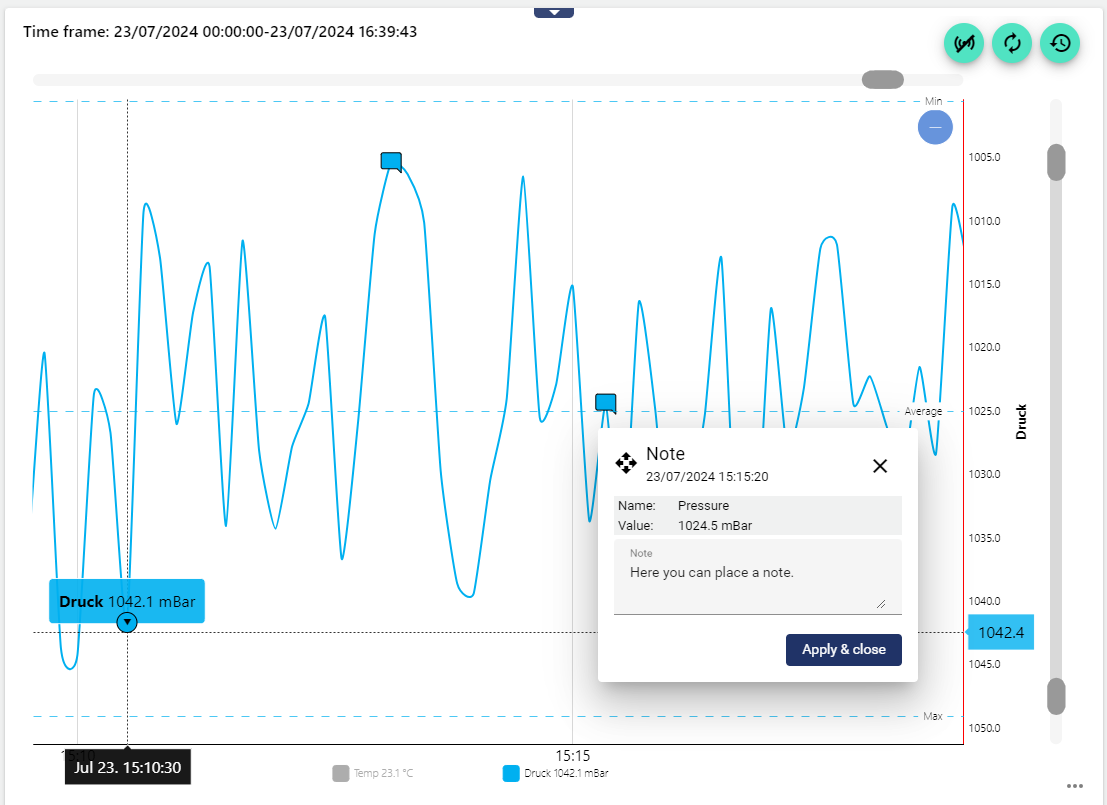
From now on, annotations can be entered directly in the diagram. These annotations are saved permanently in the “process intervall” and listed in Widget: Manuel Data as comments and in the audit log.
-
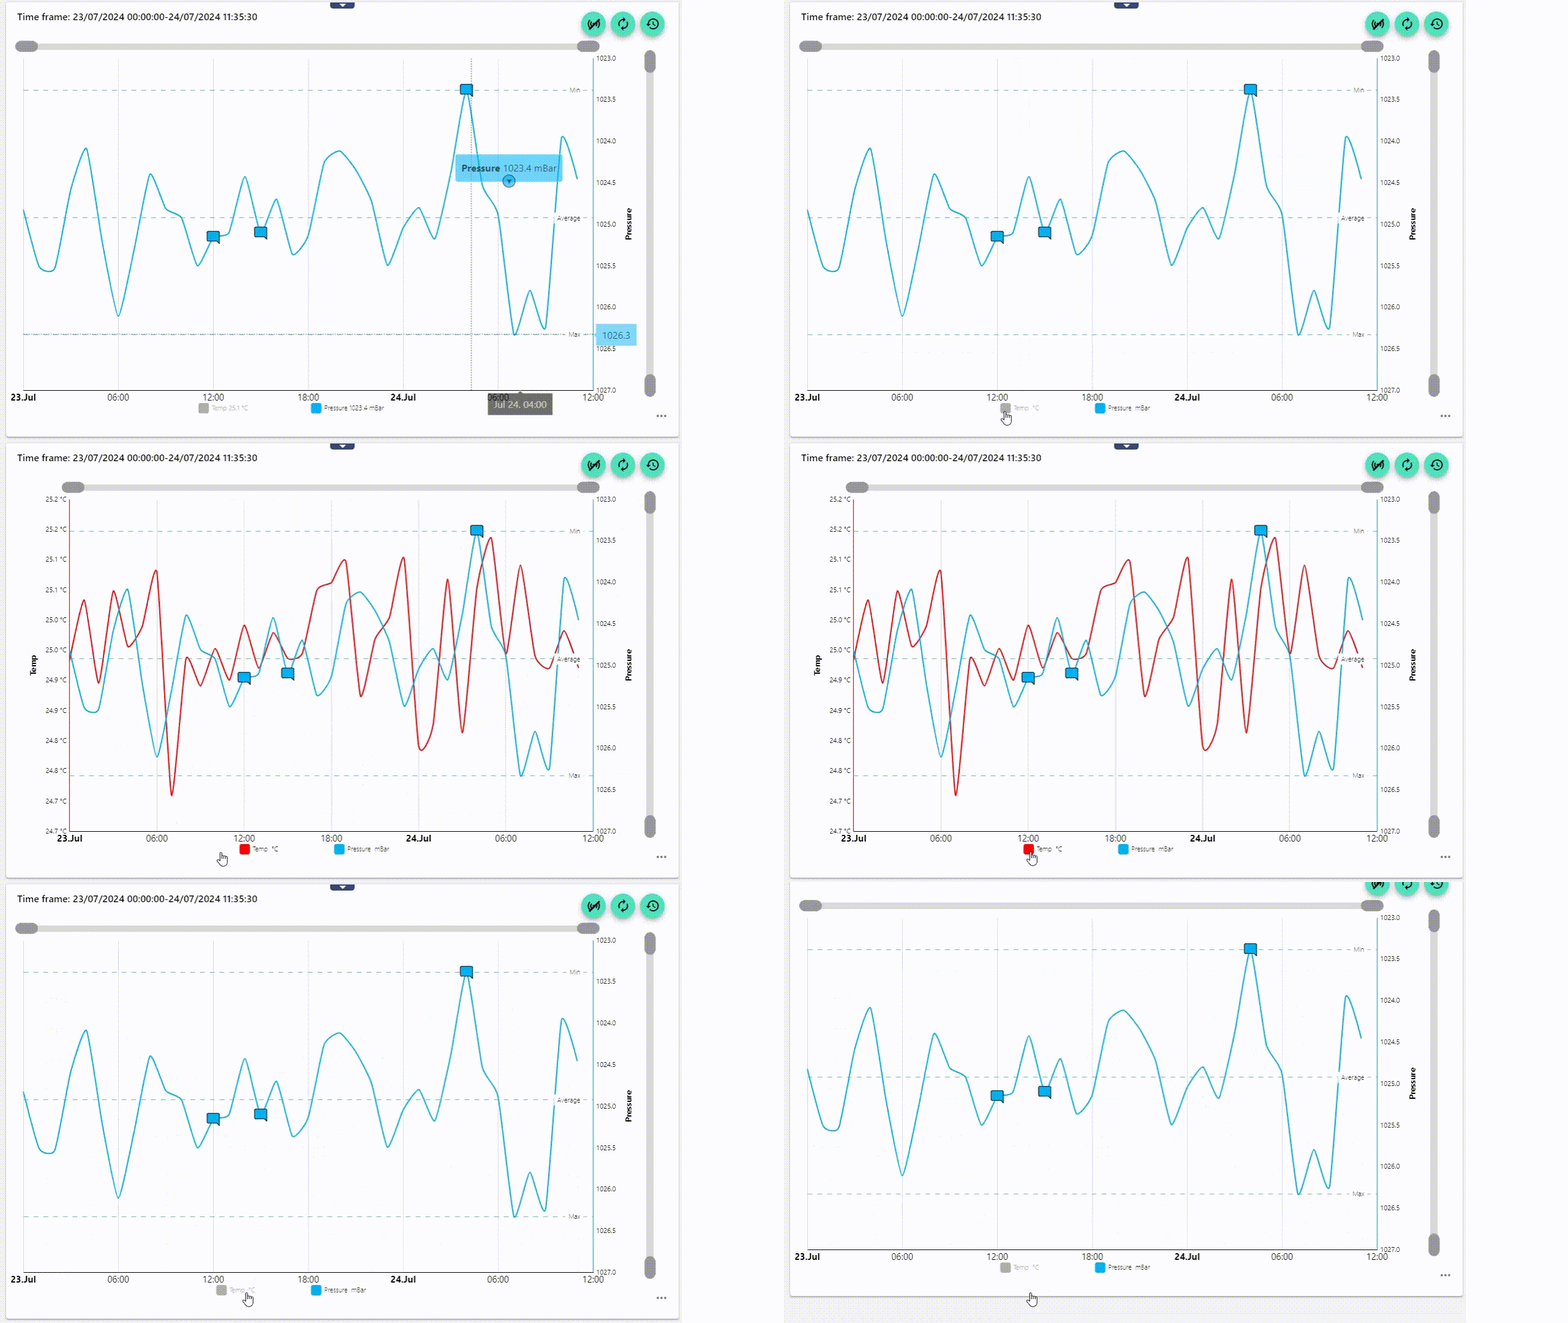
With the new version, it is possible to change the order of the individual signals in the legend. To do this, simply drag and drop the position of the signals in the widget configuration under "Data selection".
|
Sequence A |
Sequence B |
|---|---|

|

|
-
Furthermore, in the configuration of the widget under "Series", you can set whether the chart is displayed actively by default or not. In the example below, the temperature is deselected. It can be activated at any time with a click.
3.) From this version onwards, dashboard tabs with all widgets can be copied quickly and easily. This leads to considerable time savings for visualization tasks that regularly work with identically structured dashboards. In addition, objects used (such as signals, conditions, events, etc.) can now be easily exchanged via the dashboard tab settings. By using "placeholders", the "titles" of several widgets used in the dashboard tab can be changed quickly and easily.
-
Copy: A copy of the tab with all widgets is created. Both tabs can be edited independently of each other.
-
Copy and link: A copy of the tab with all widgets is created. Only the source tab can be edited. The changes are applied to the linked tab at the same time. Only the placeholder values and the objects (signals, conditions, etc.) can be edited.
More information at: Copy dashboard tab
If a widget is moved in a tab that has several linked tabs, it moves to the same position in the linked tabs at the same time.
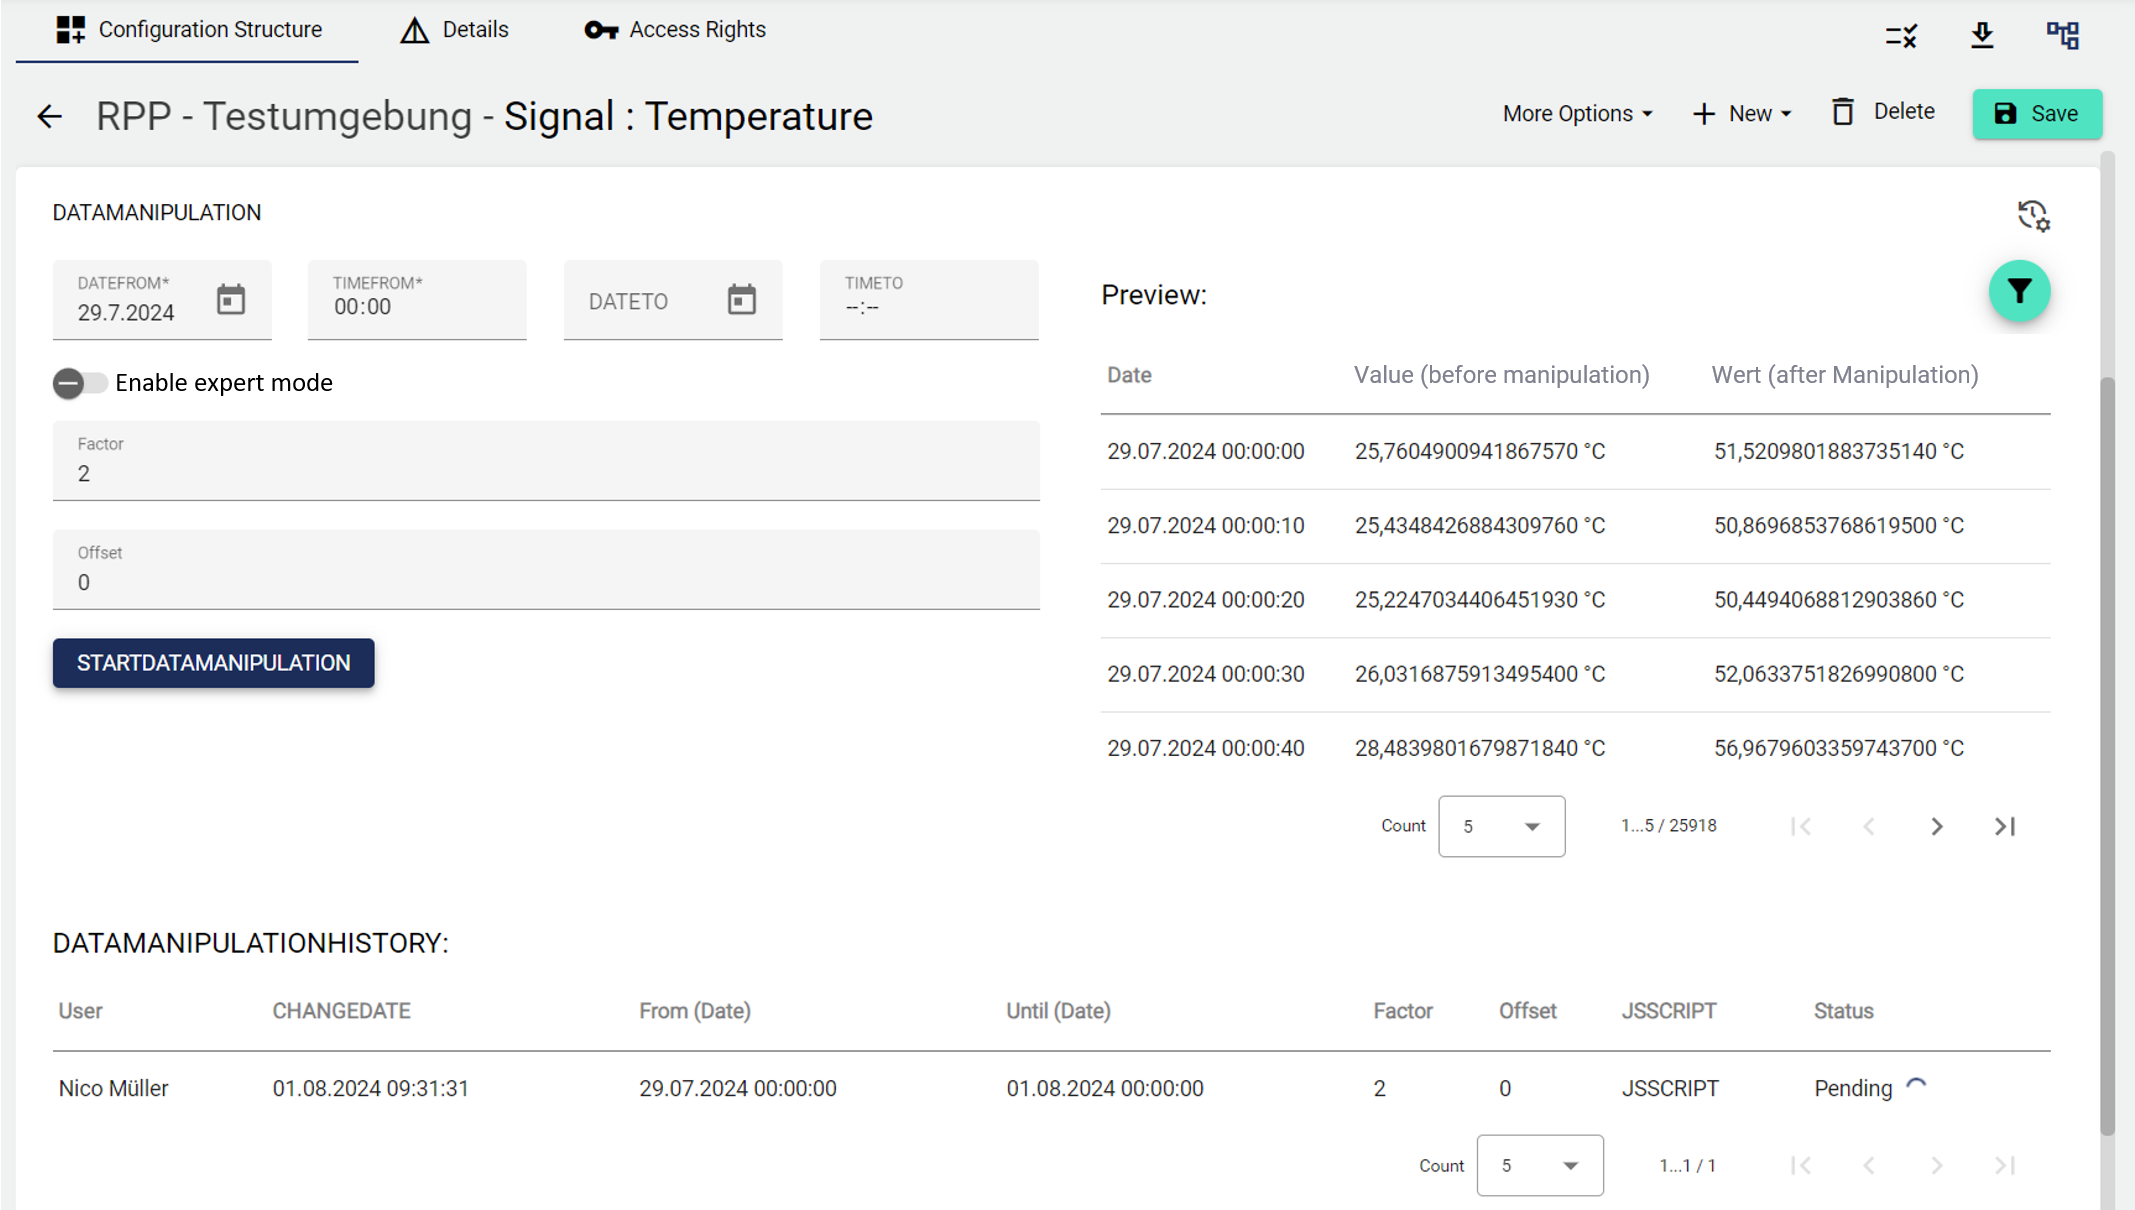
4.) Incorrectly recorded data can now be corrected by the user in the signal settings. The original data is not changed in the process. The data change can be undone at any time. A data change is recorded in the audit log.
This function can be used, for example, to retroactively change the physical unit of a signal (change of historical data).
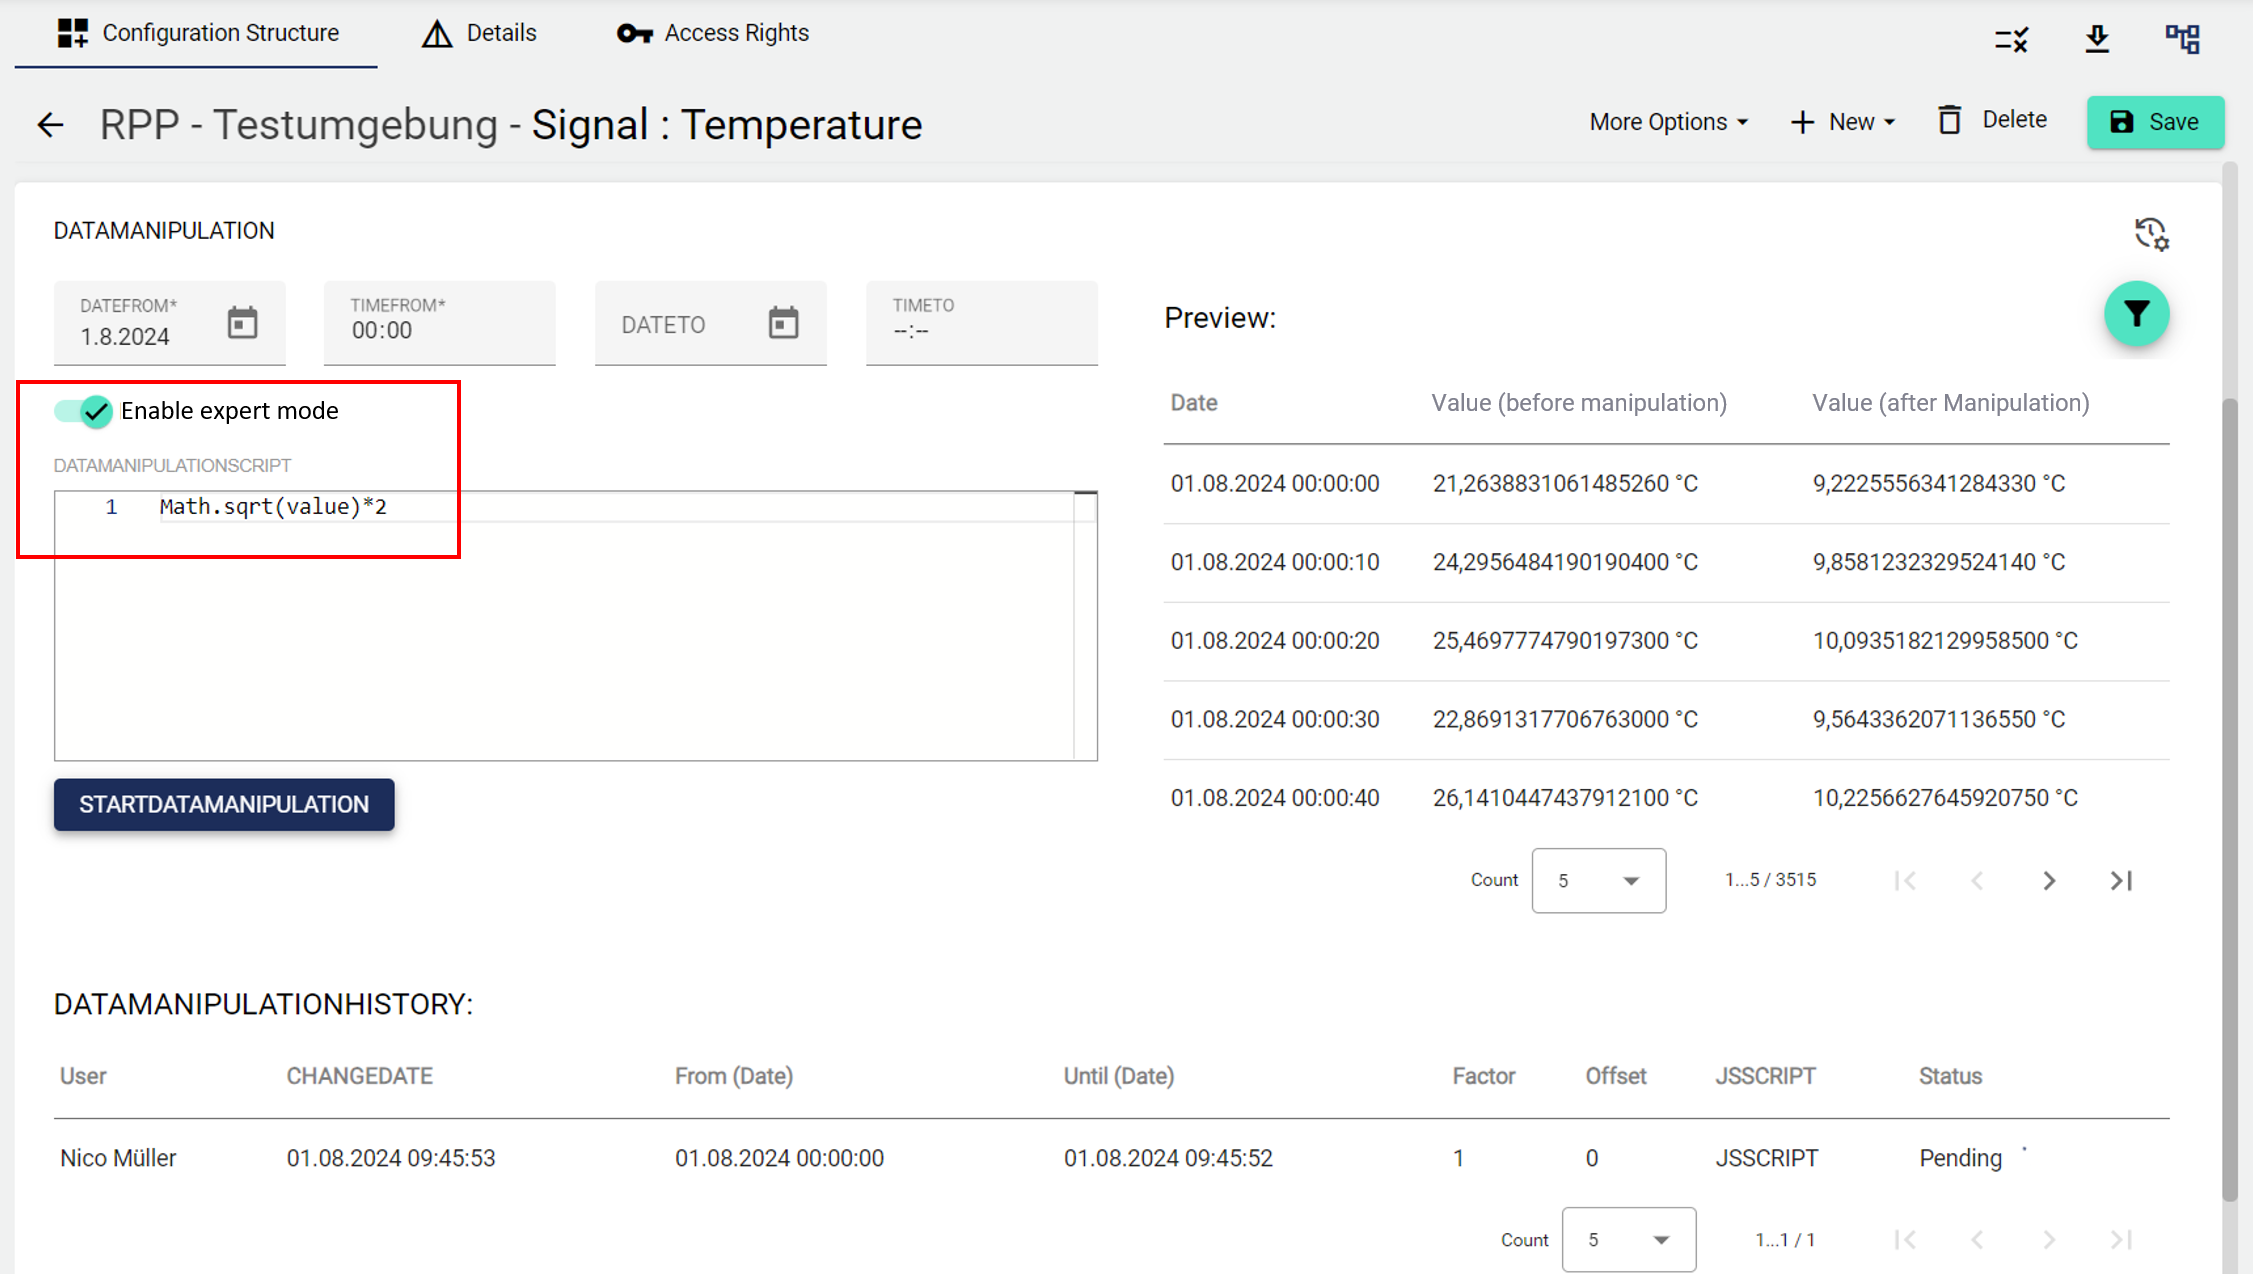
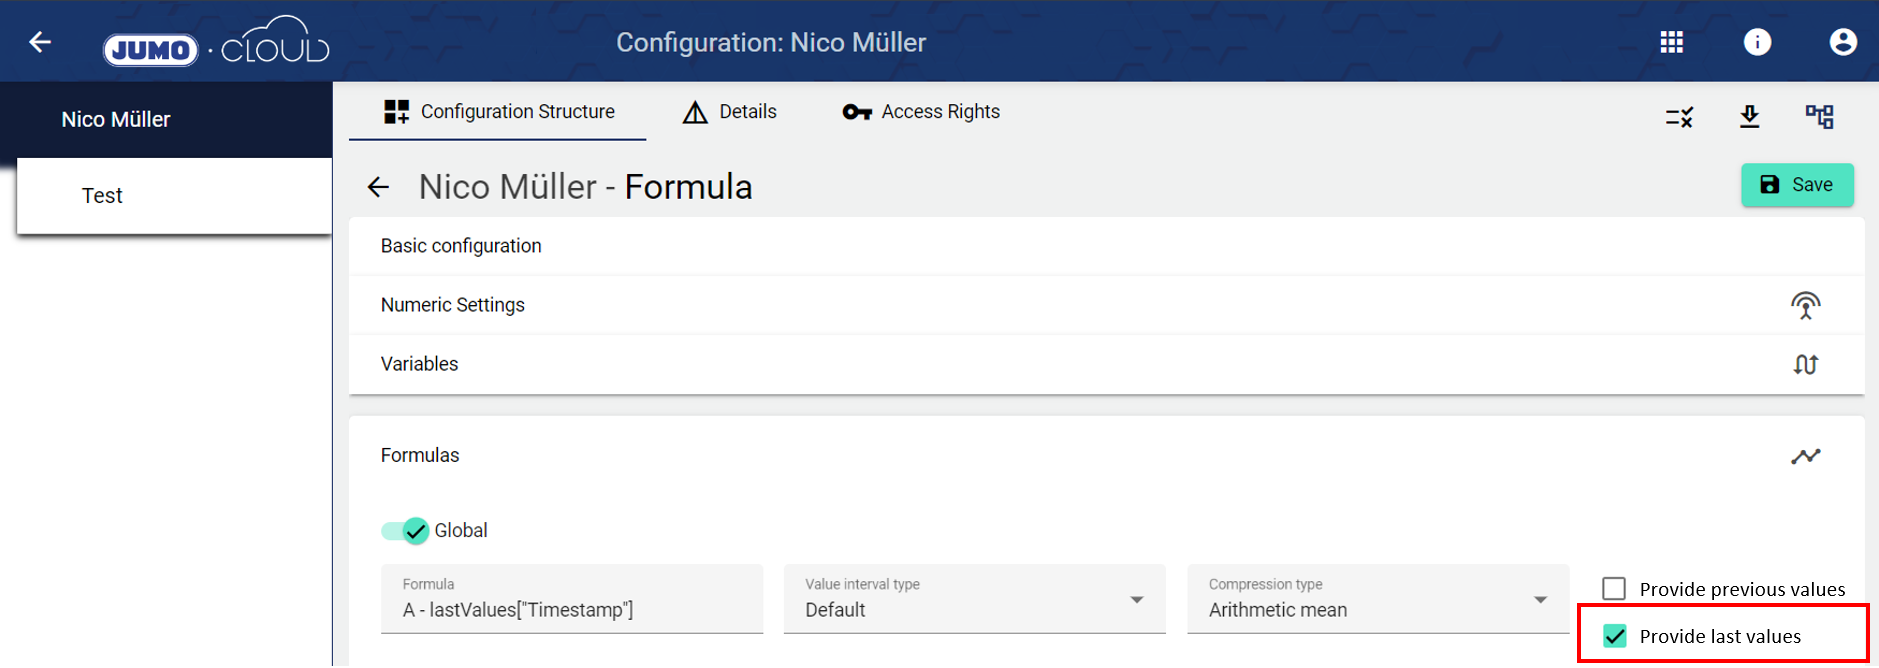
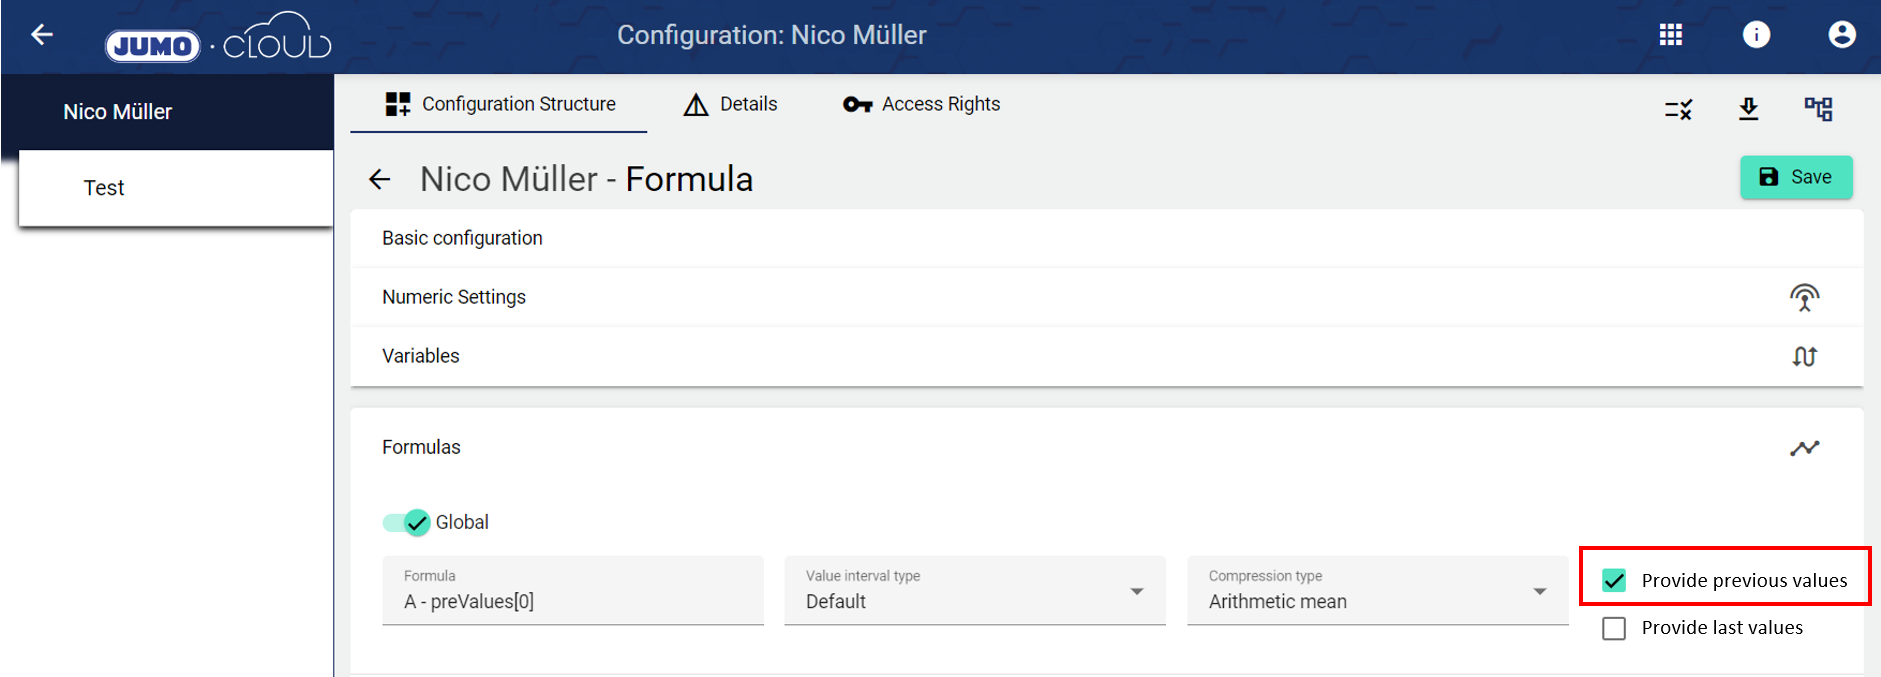
5.) From now on, in addition to "With previous values", "Provide last values" can also be calculated within the formula creation. More under Formulas.
Provide previous values: Allows you to access previous interval values (hour, day, etc.) using the preValues[...] function. For example, the hour value of 2:00 can be offset against the value of 1:00.
Provide last values: Allows you to calculate with the lastValues["Variable_name"] function. This returns the last value of the variable at the time of the formula calculation.
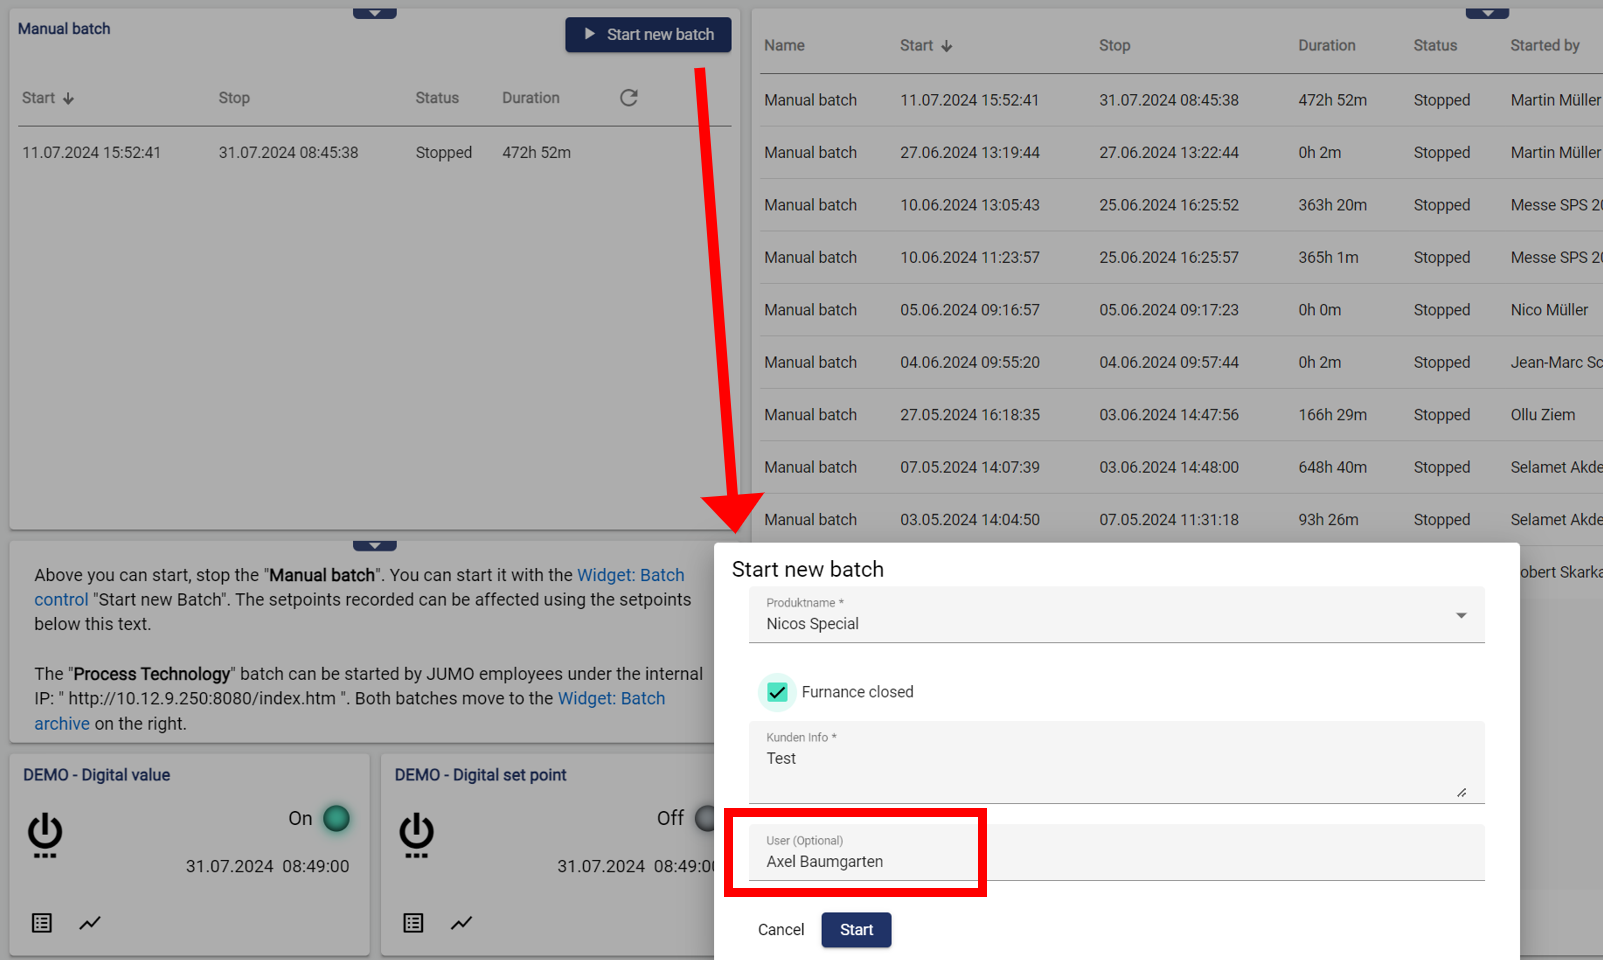
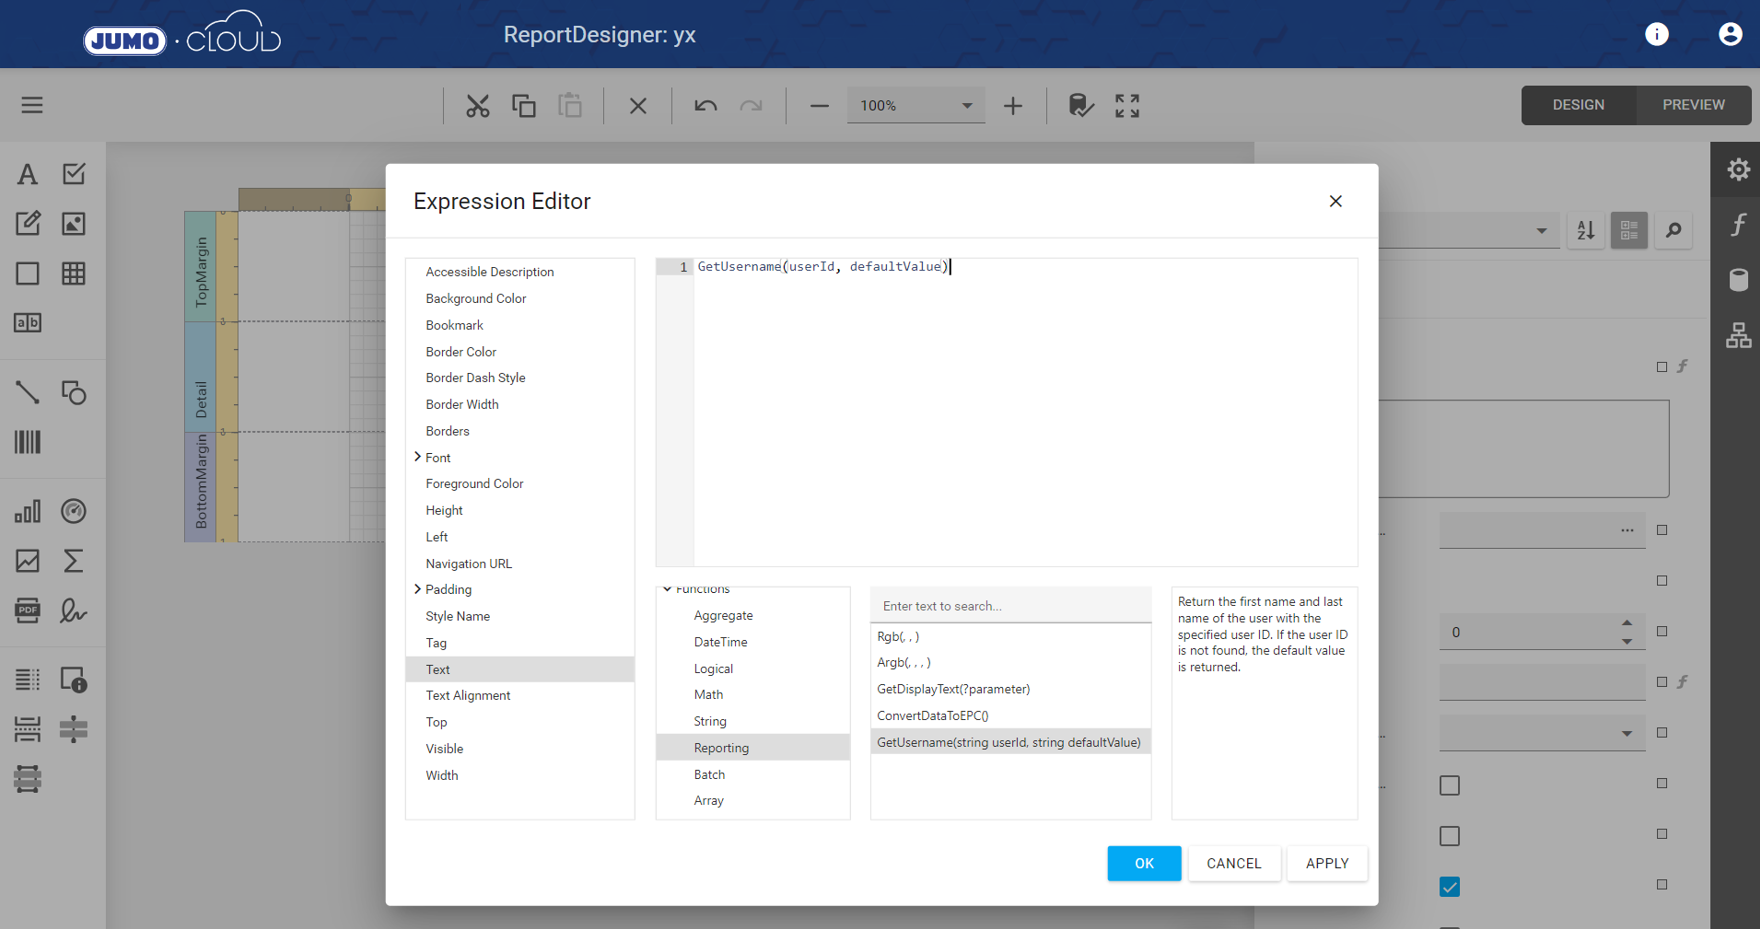
6.) If a user is selected in the header data of the batch function, they can appear in the report with their first name and surname in version 4.15.
7.) Bug fix and system maintenance
