
Process values widget
The individual process values are listed in a table by date and time.
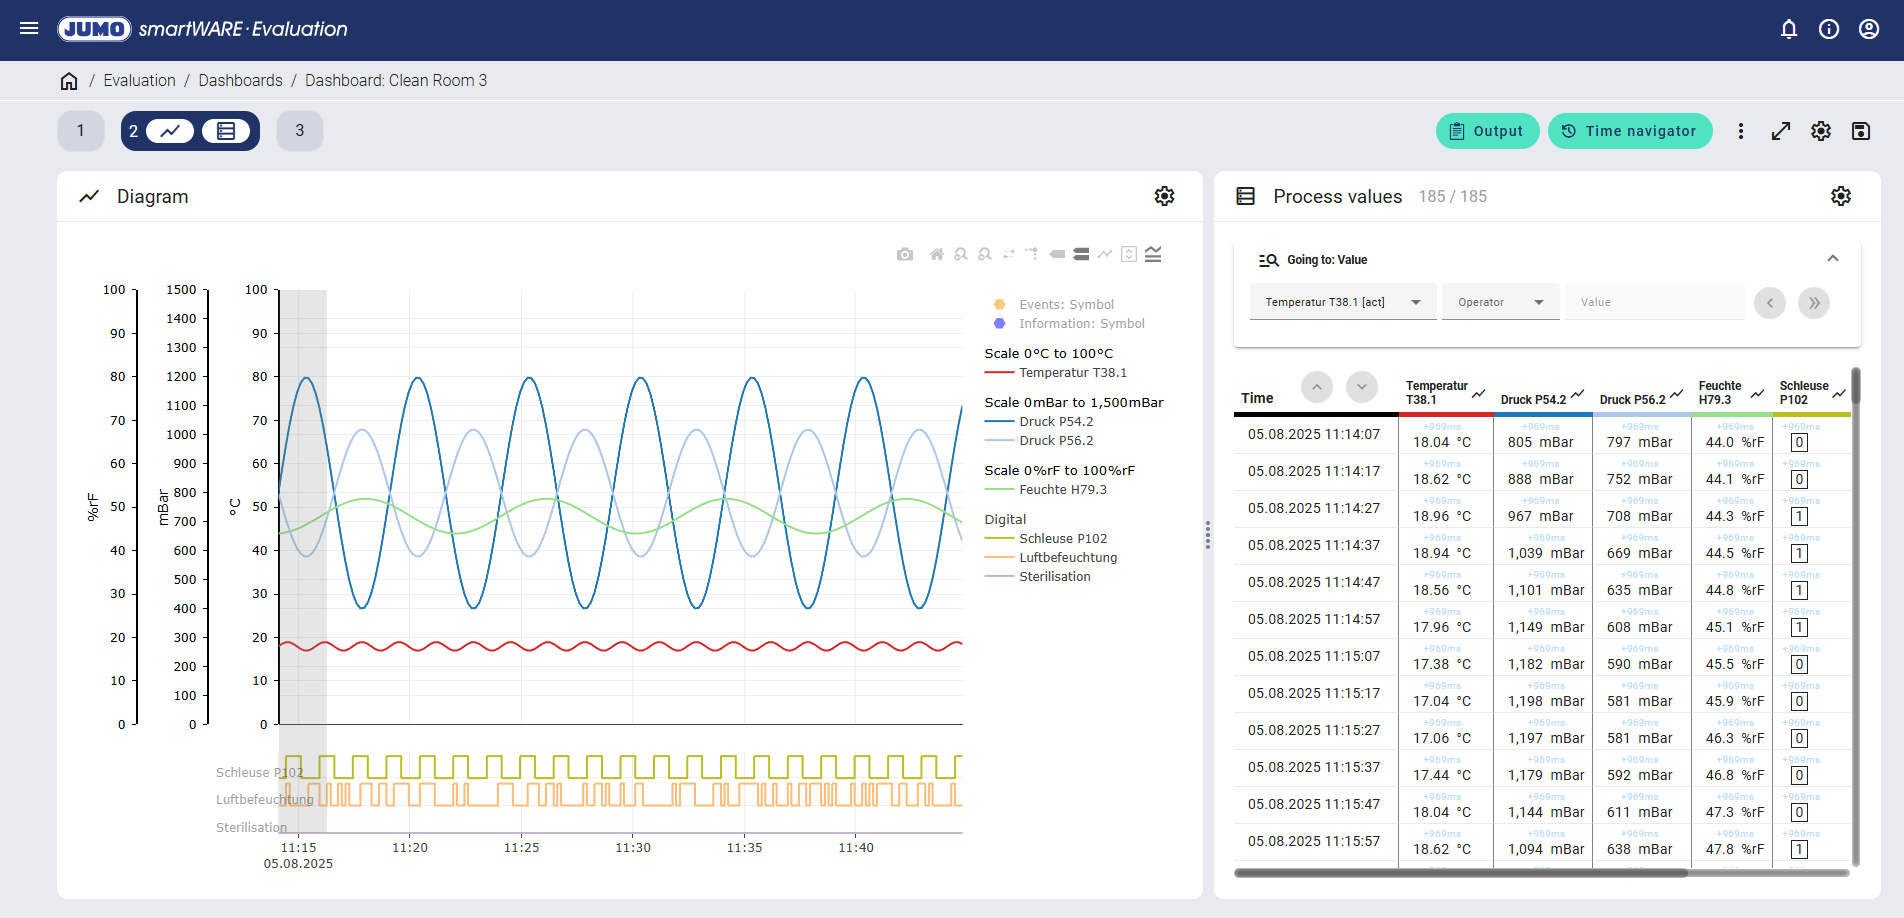
The date and time of the acquired process value is displayed in the left-hand area of the process value table. The recorded process value, the unit, and the internal memory cycle for the device (e.g. +969 ms) are displayed for each analog value.
Is there a relationship between the process value table and diagram?
The time range shown in the process value table is shown highlighted in gray in the diagram. If the user scrolls to the bottom in the process value table, the time range highlighted in gray in the diagram moves to the right.
The relevant measuring point is automatically shown in the diagram when hovering over the process value table. This results in a direct graphical association between the curve diagram and the associated process values.
Clicking in the table and on the "Add new note" icon creates a note for each process value.
Go-to function
A quick evaluation of the process data can be performed using the go-to function.
For example, the analog value "Temperature T38.1" can be filtered with an operator (e.g. measured value exceedance) and a value (e.g. 18.7 °C).
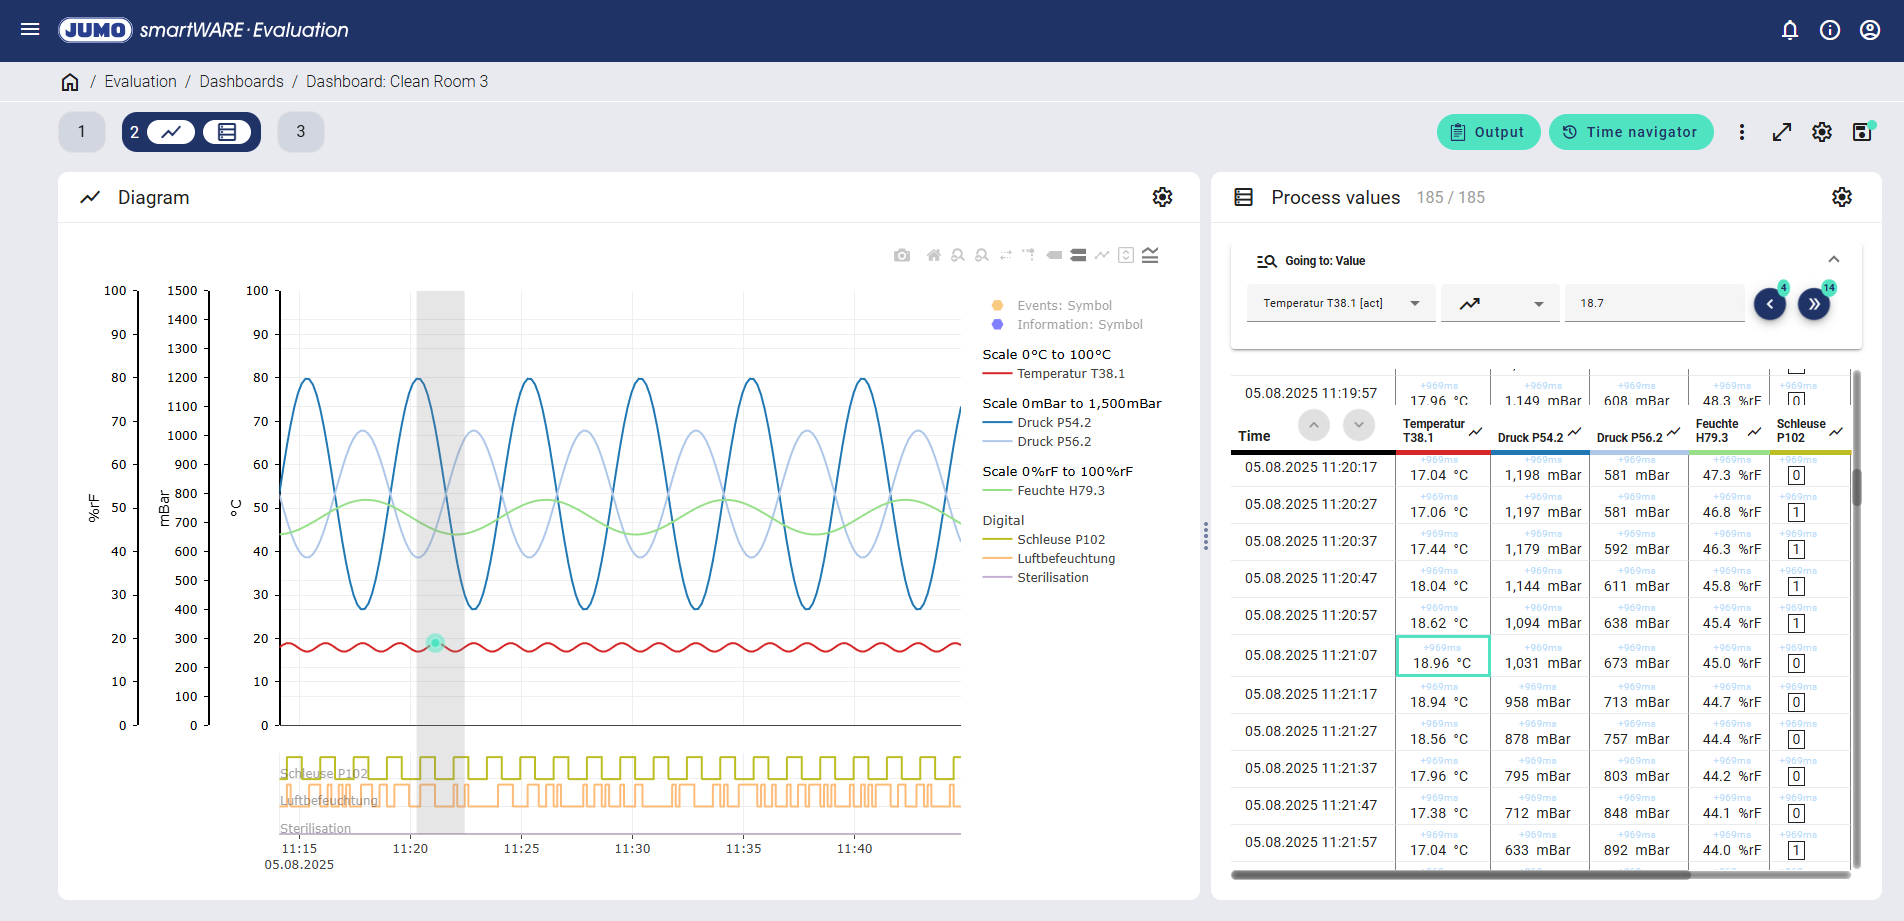
The filtered value is highlighted in mint-green both in the process value table and in the curve diagram. Furthermore, the number of filtered events is displayed as a number above the arrows in the process value table. By clicking on the arrows, all measured values above 18.7 °C can now be filtered and evaluated.
The "Time" function can be used to filter the process data by date and time with the following operators:
Operator | Explanation | |
|---|---|---|
Equal | Only one hit is displayed if the value exists. | |
Approximate | Only one hit is displayed if the value itself does not precisely exist. The value that follows the value which is being searched for is specified. | |
Period change | A hit is displayed if the period or cycle changes. Example: | |
The process data is acquired according to NAMUR NE 107. All process values can be filtered according to the four standardized diagnosis signals (failure, function check, maintenance required, out of specification) using the "All visible columns" function. If one of the status signals is detected, it is displayed in the table with the relevant process value.
Operator | Status signal according to NAMUR NE 107 | |
|---|---|---|
Status signals | F/C/M/S | |
Failure | F | |
Function check | C | |
Maintenance required | M | |
Out of specification | S | |
The "Analog" function can be used to filter the process data with the following operators:
Operator | Explanation | |
|---|---|---|
Approximate | A search is carried out in a tolerance range of ±0.5 around the input value. One hit is displayed if one value within the tolerance range exists. | |
Crossover | If the input value is exceeded or fallen below, one hit is displayed. | |
Value exceeded | If the input value is exceeded, one hit is displayed. The next-highest value is specified as the hit. | |
Value fallen below | If the input value is fallen below, one hit is displayed. The next-lowest value is specified as the hit. | |
The "Digital" function can be used to filter the process data with the following operators:
Operator | Explanation | |
|---|---|---|
Equal | If the input value exists, one hit is displayed. | |
Crossover | If the input value is exceeded or fallen below, one hit is displayed. | |
Value exceeded | If the input value is exceeded, one hit is displayed. The next-highest value is specified as the hit. | |
Value fallen below | If the input value is fallen below, one hit is displayed. The next-lowest value is specified as the hit. | |
Settings
Analysis
A distinction is made between analog and digital when setting the channels.
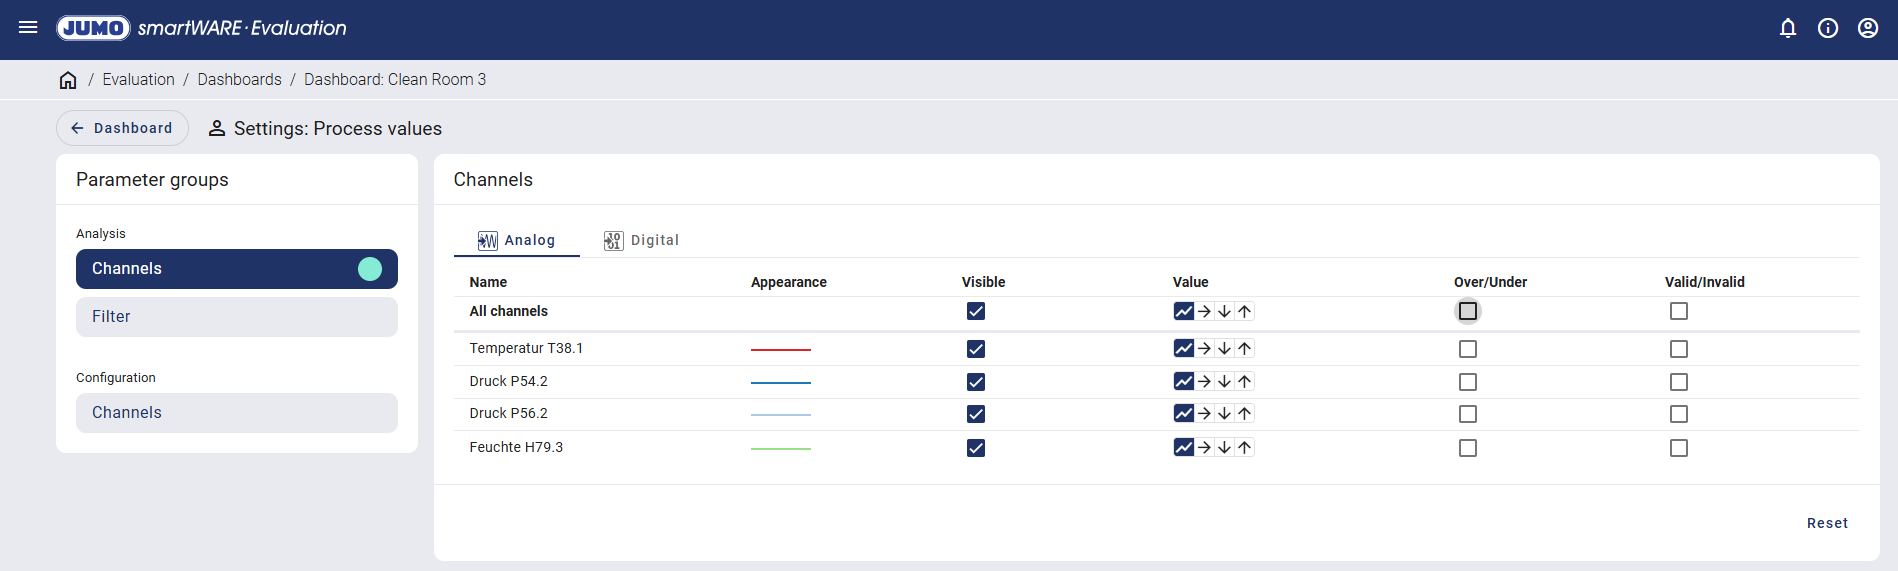
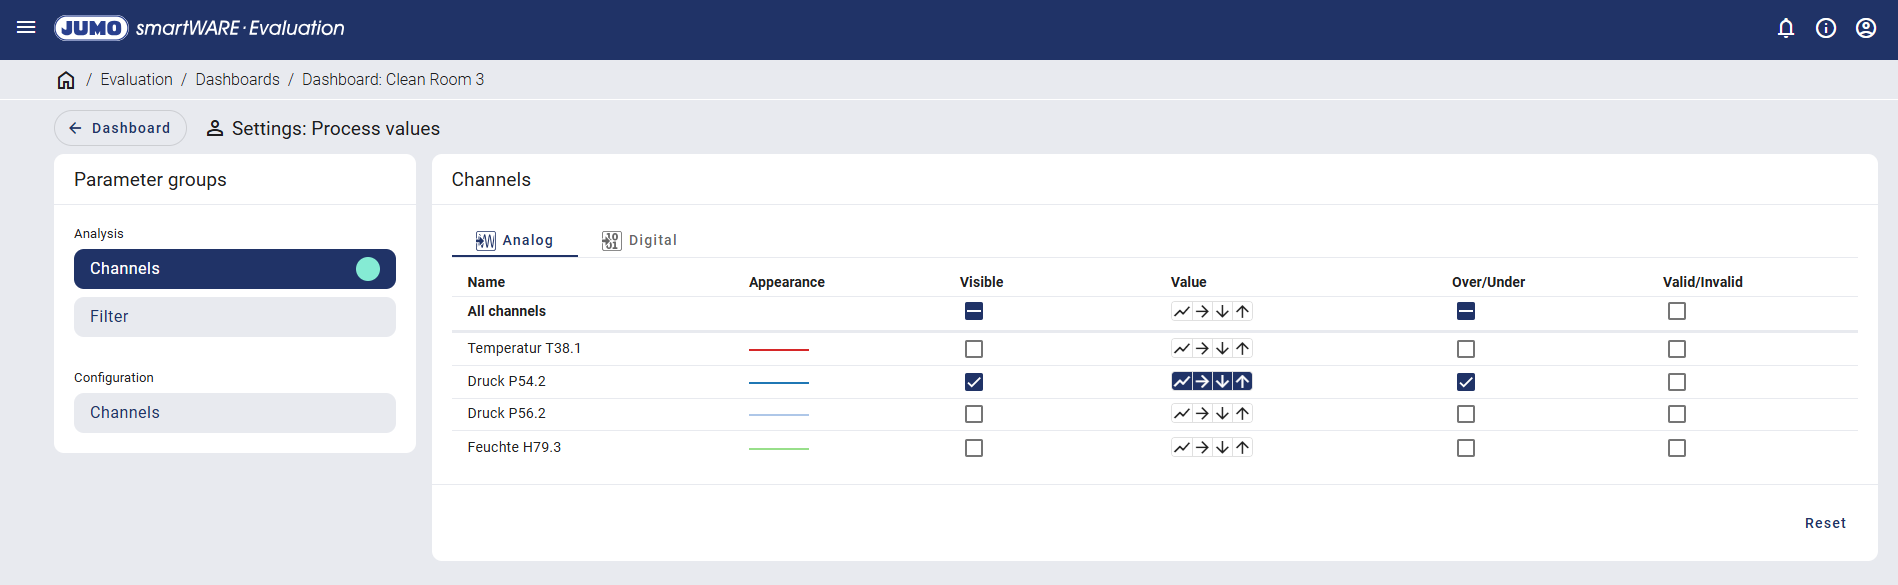
The analysis functions for analog values are described based on the example of the analog value "Druck P54.2" (Pressure P54.2).
The four following values can be selected for the analog value:
Operator | Explanation | |
|---|---|---|
Current value | Value at the end of the sampling period. | |
Average value | Average of all values within the sampling period. | |
Min. value | Minimum value of all values within the sampling period. | |
Max. value | Maximum value of all values within the sampling period. | |
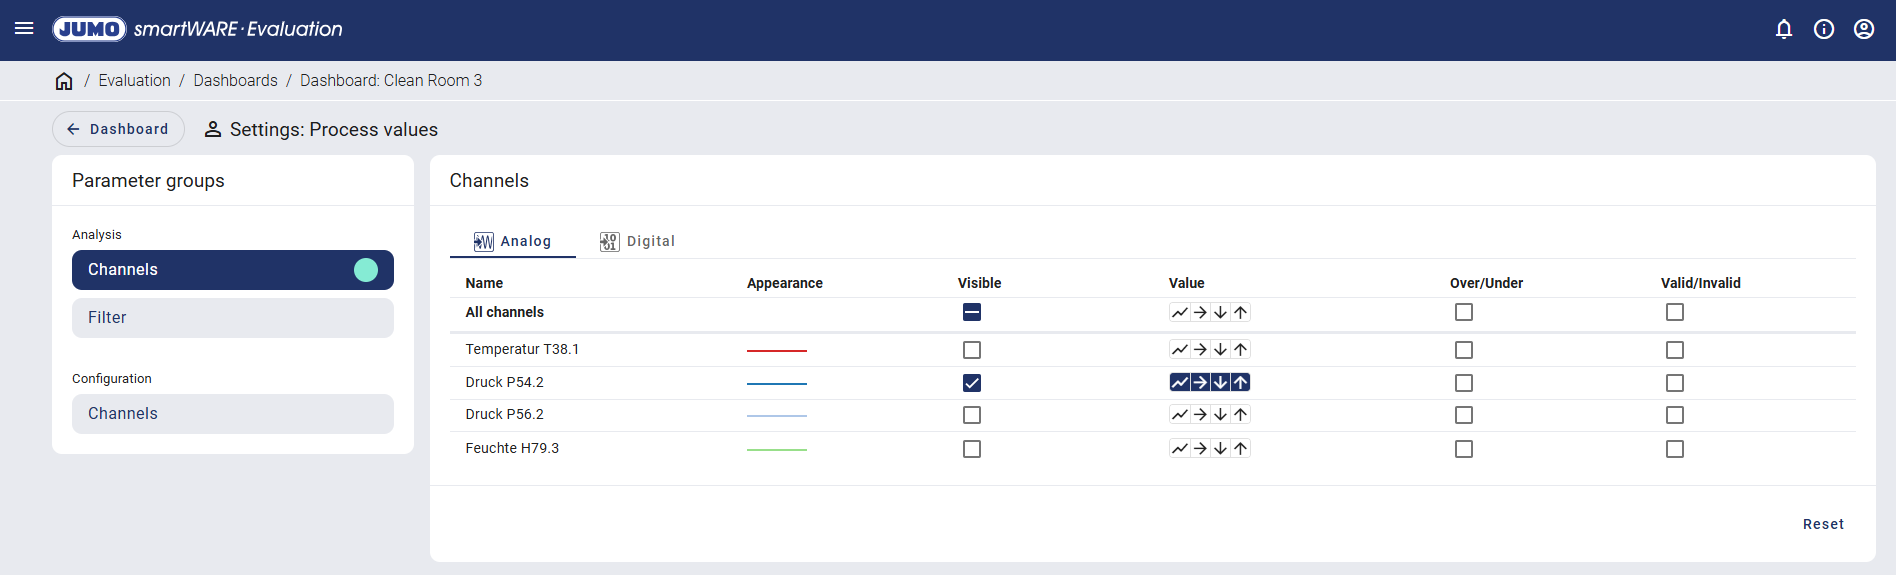
Selecting all four values expands the process value table to include the relevant columns.
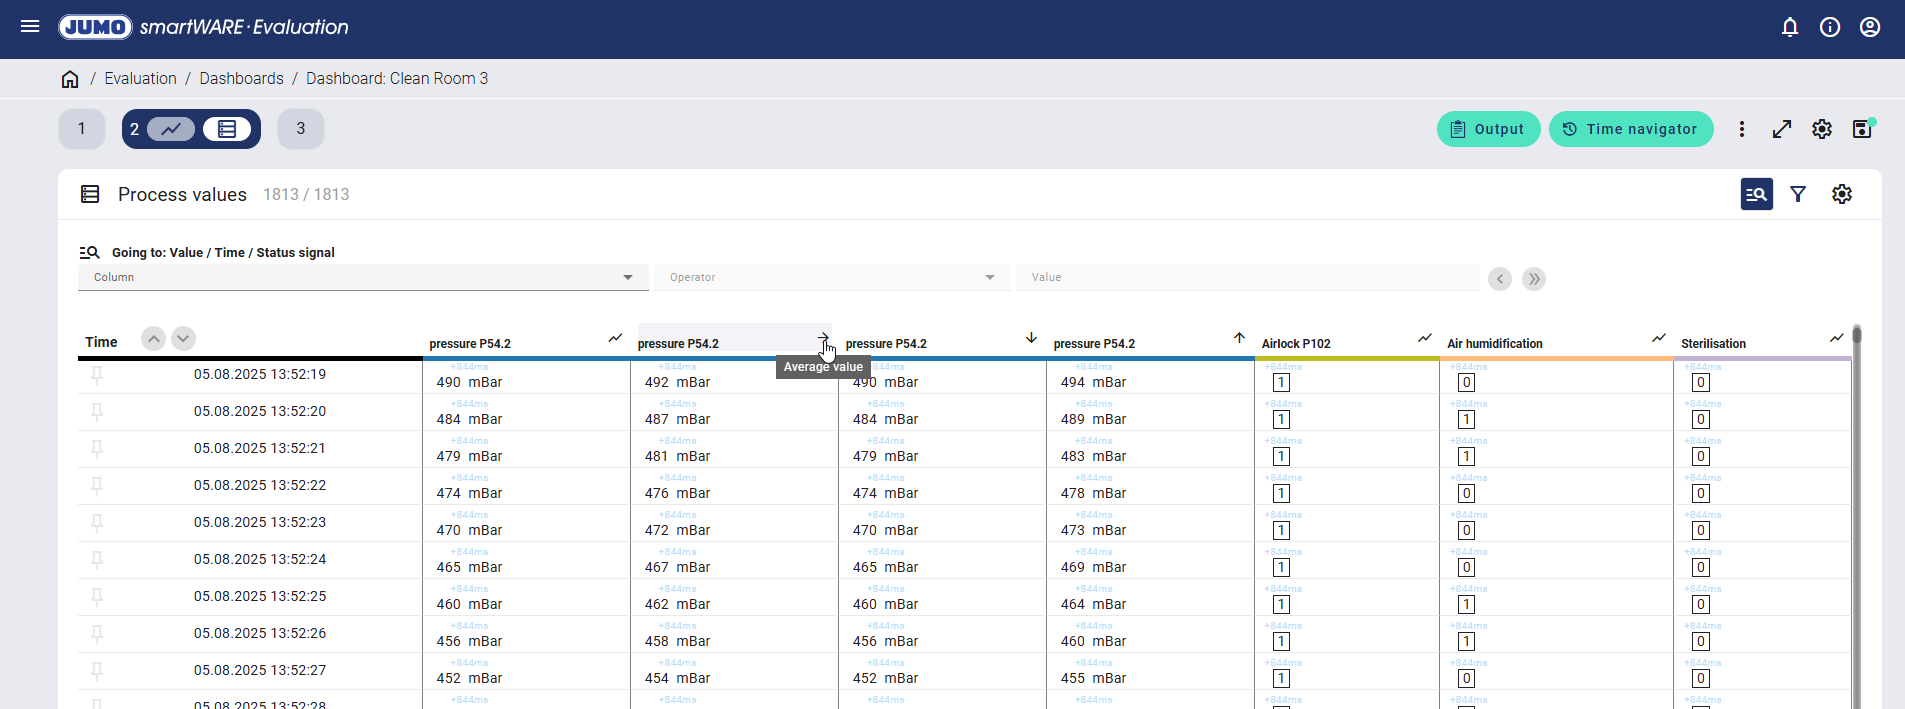
When hovering over the table header, the type of measured value is displayed (the average value in this example). The example shows that the data measured for the current value is 490 mBar, 492 mBar for the average value, 490 mBar for the minimum value, and 494 mBar for the maximum value when saving every second. Additional saving of the minimum and maximum value is not available with compact storage.
If the "Over/Under" function is also activated, the number of measured values with measuring range overflow or underflow within the sampling period is displayed. This function is not available with compact storage.
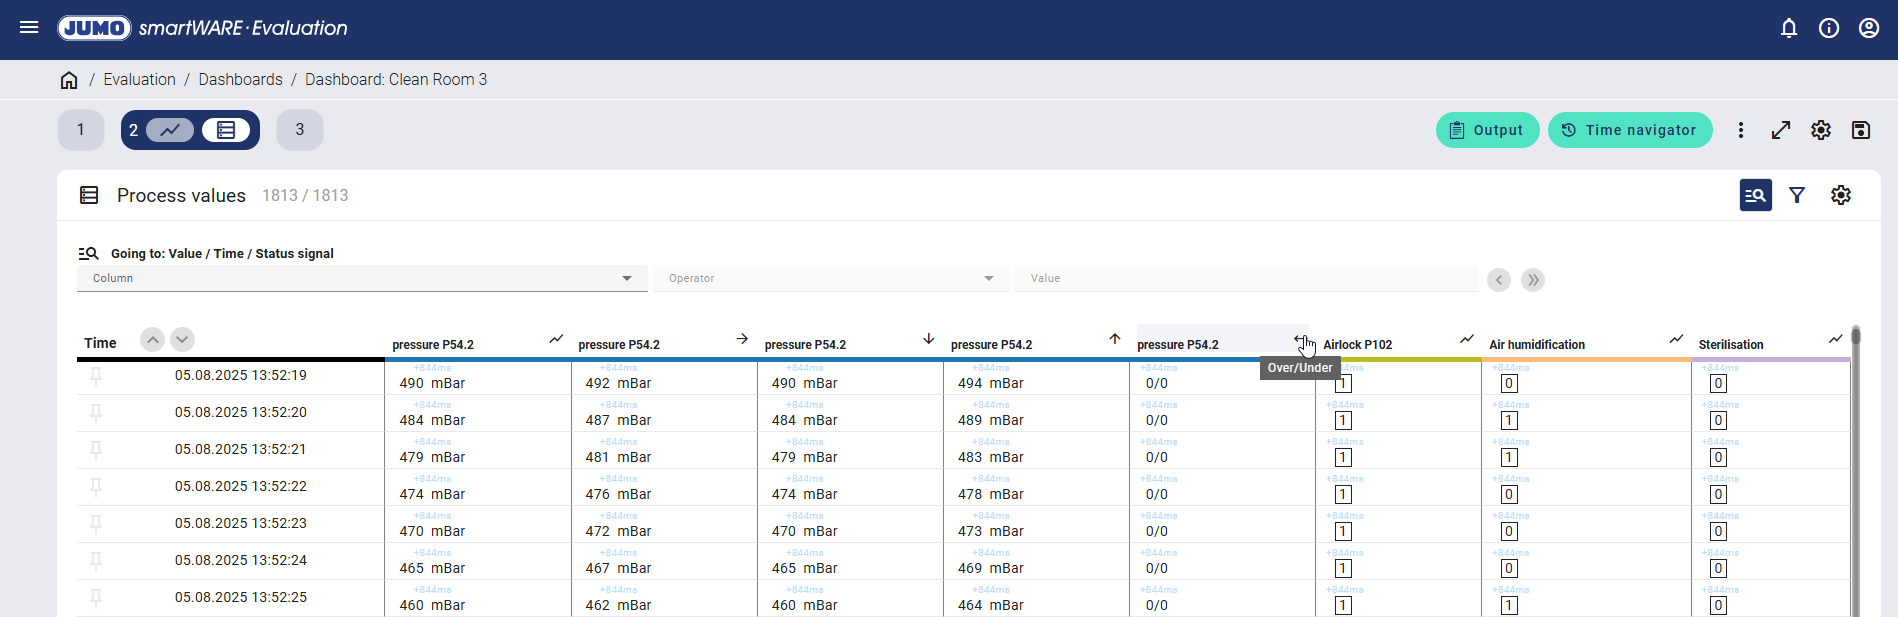
Neither measuring range overflows nor underflows occurred in the example shown when saving every second.
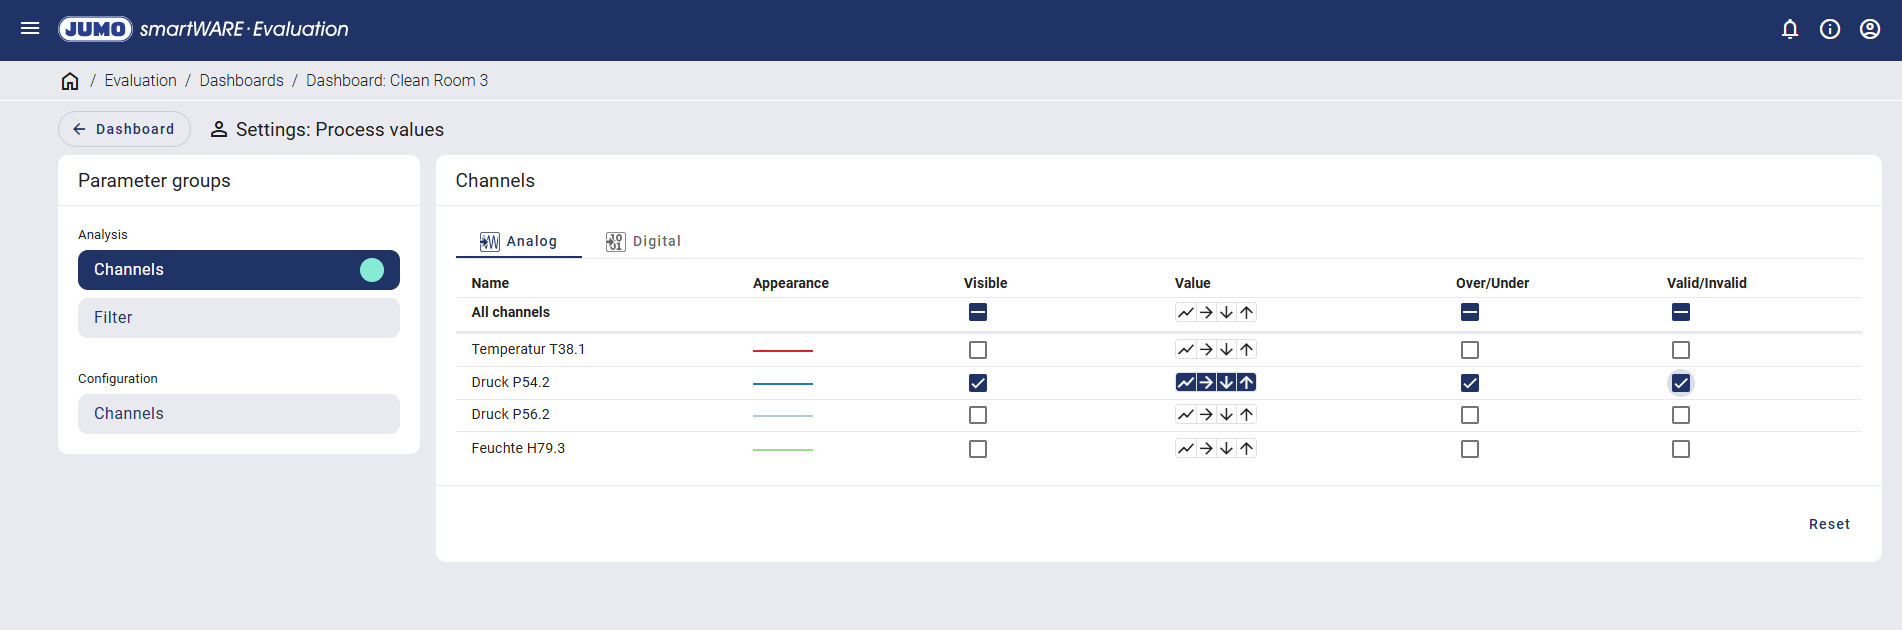
The "Valid/Invalid" function indicates how many values were valid or invalid during the sampling period. The number of invalid values comprises both the measuring range overflows and underflows as well as all other values that do not have the measured value status Valid, such as NoInput values. This function is not available with compact storage.
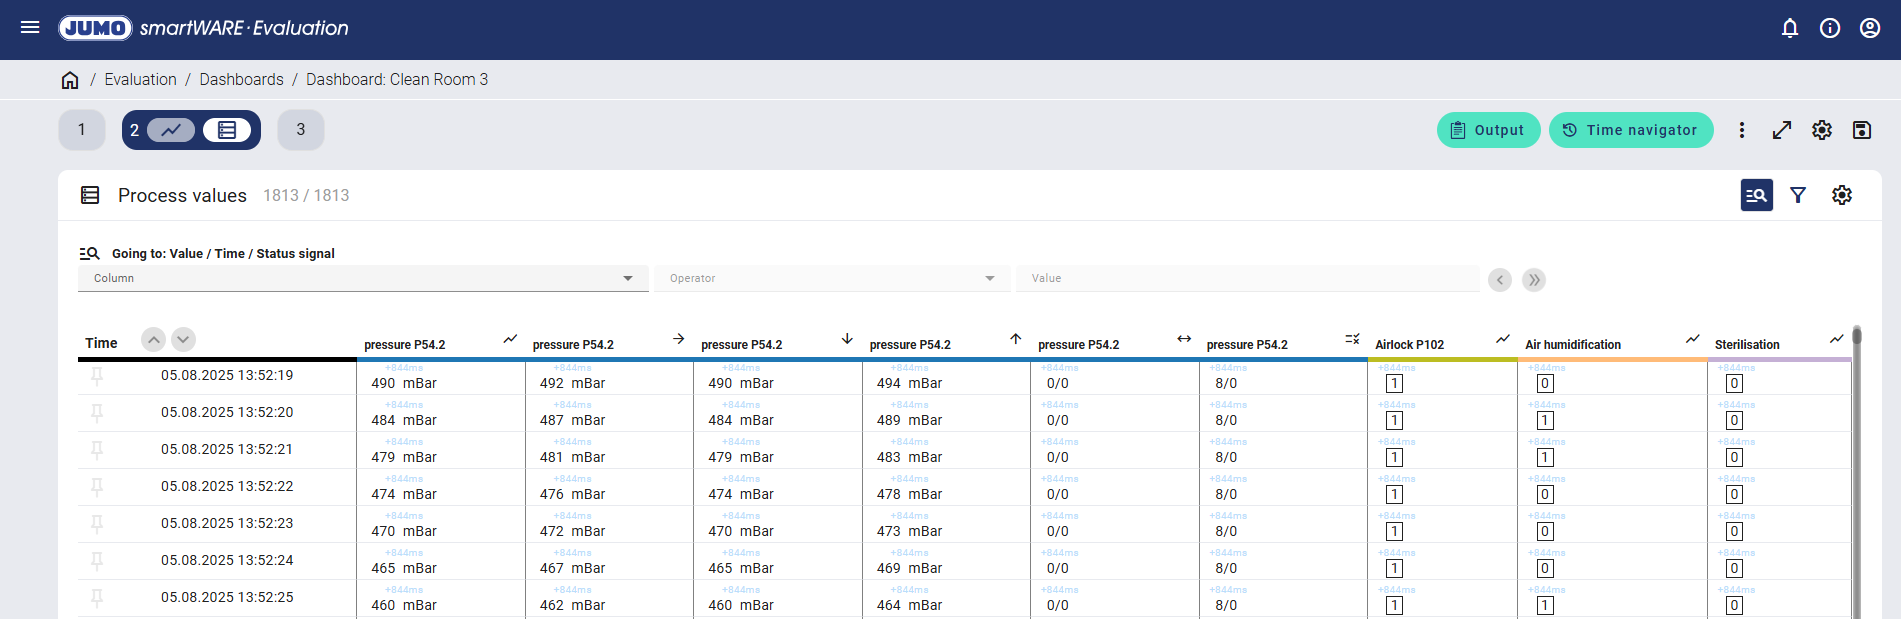
In the example shown, 8 sampling processes took place when saving every second. All values were valid.
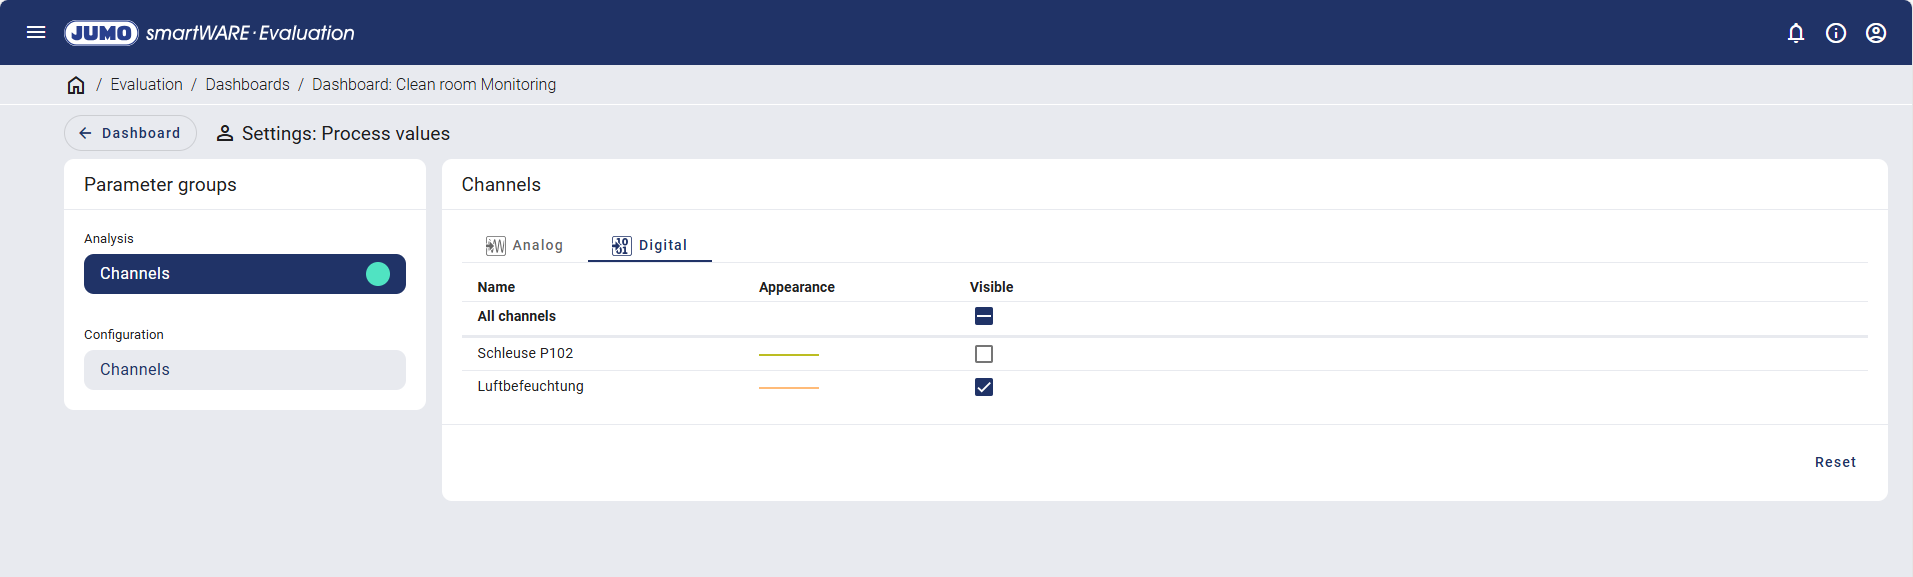
The digital channels can be switched to be visible or invisible for the process value table.
Configuration
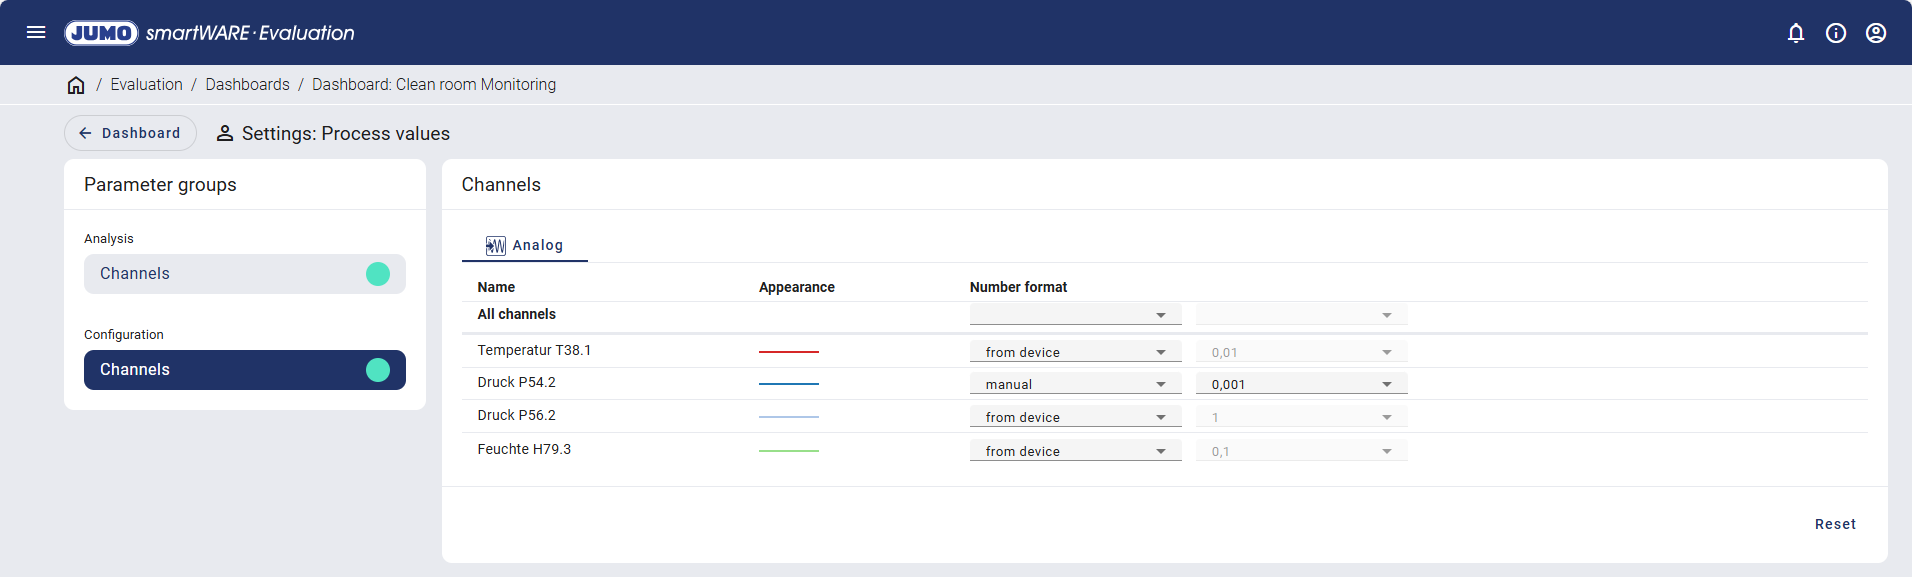
The number format can either be adopted from the connected device or manually defined for each analog channel.