
Recorder and recorder app
The JUMO variTRON system has an integrated recorder, which records process data. The Recorder View is available using the extra code 276 "Recorder app". It enables process data from the JUMO variTRON system to be visualized as a live trend in a curve diagram.
Features of the JUMO variTRON family
The JUMO variTRON is available in three different versions. They differ in terms of data recording as follows:
Device | Recorder | Recorder View |
|---|---|---|
JUMO variTRON 300 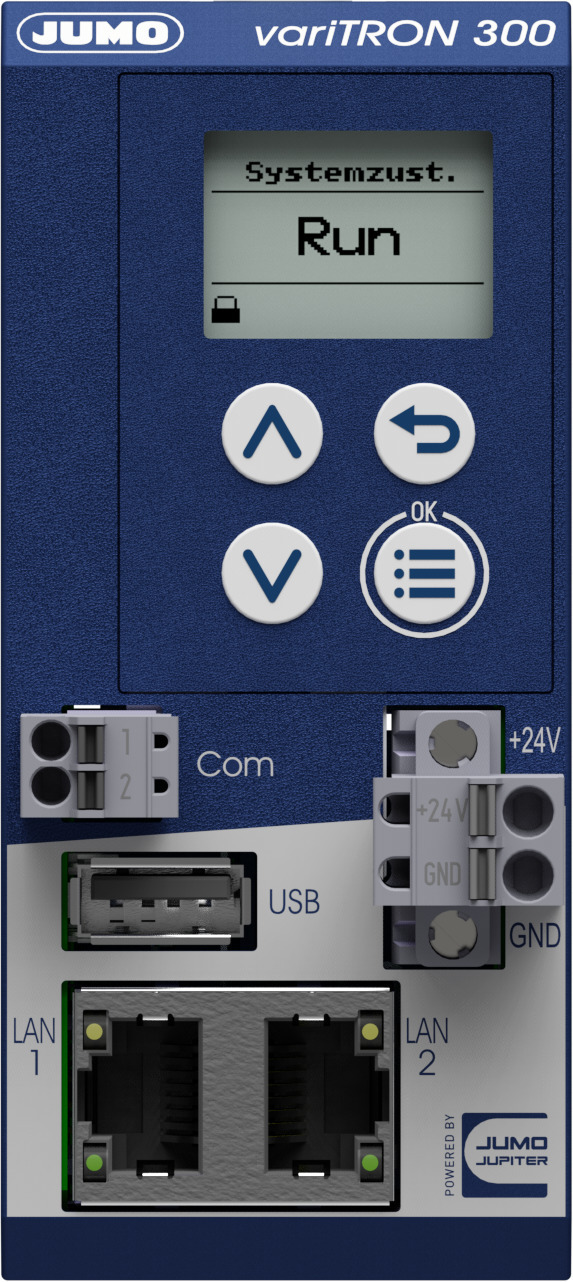 | Recording of max. 60 analog or digital signals | – |
JUMO variTRON 500 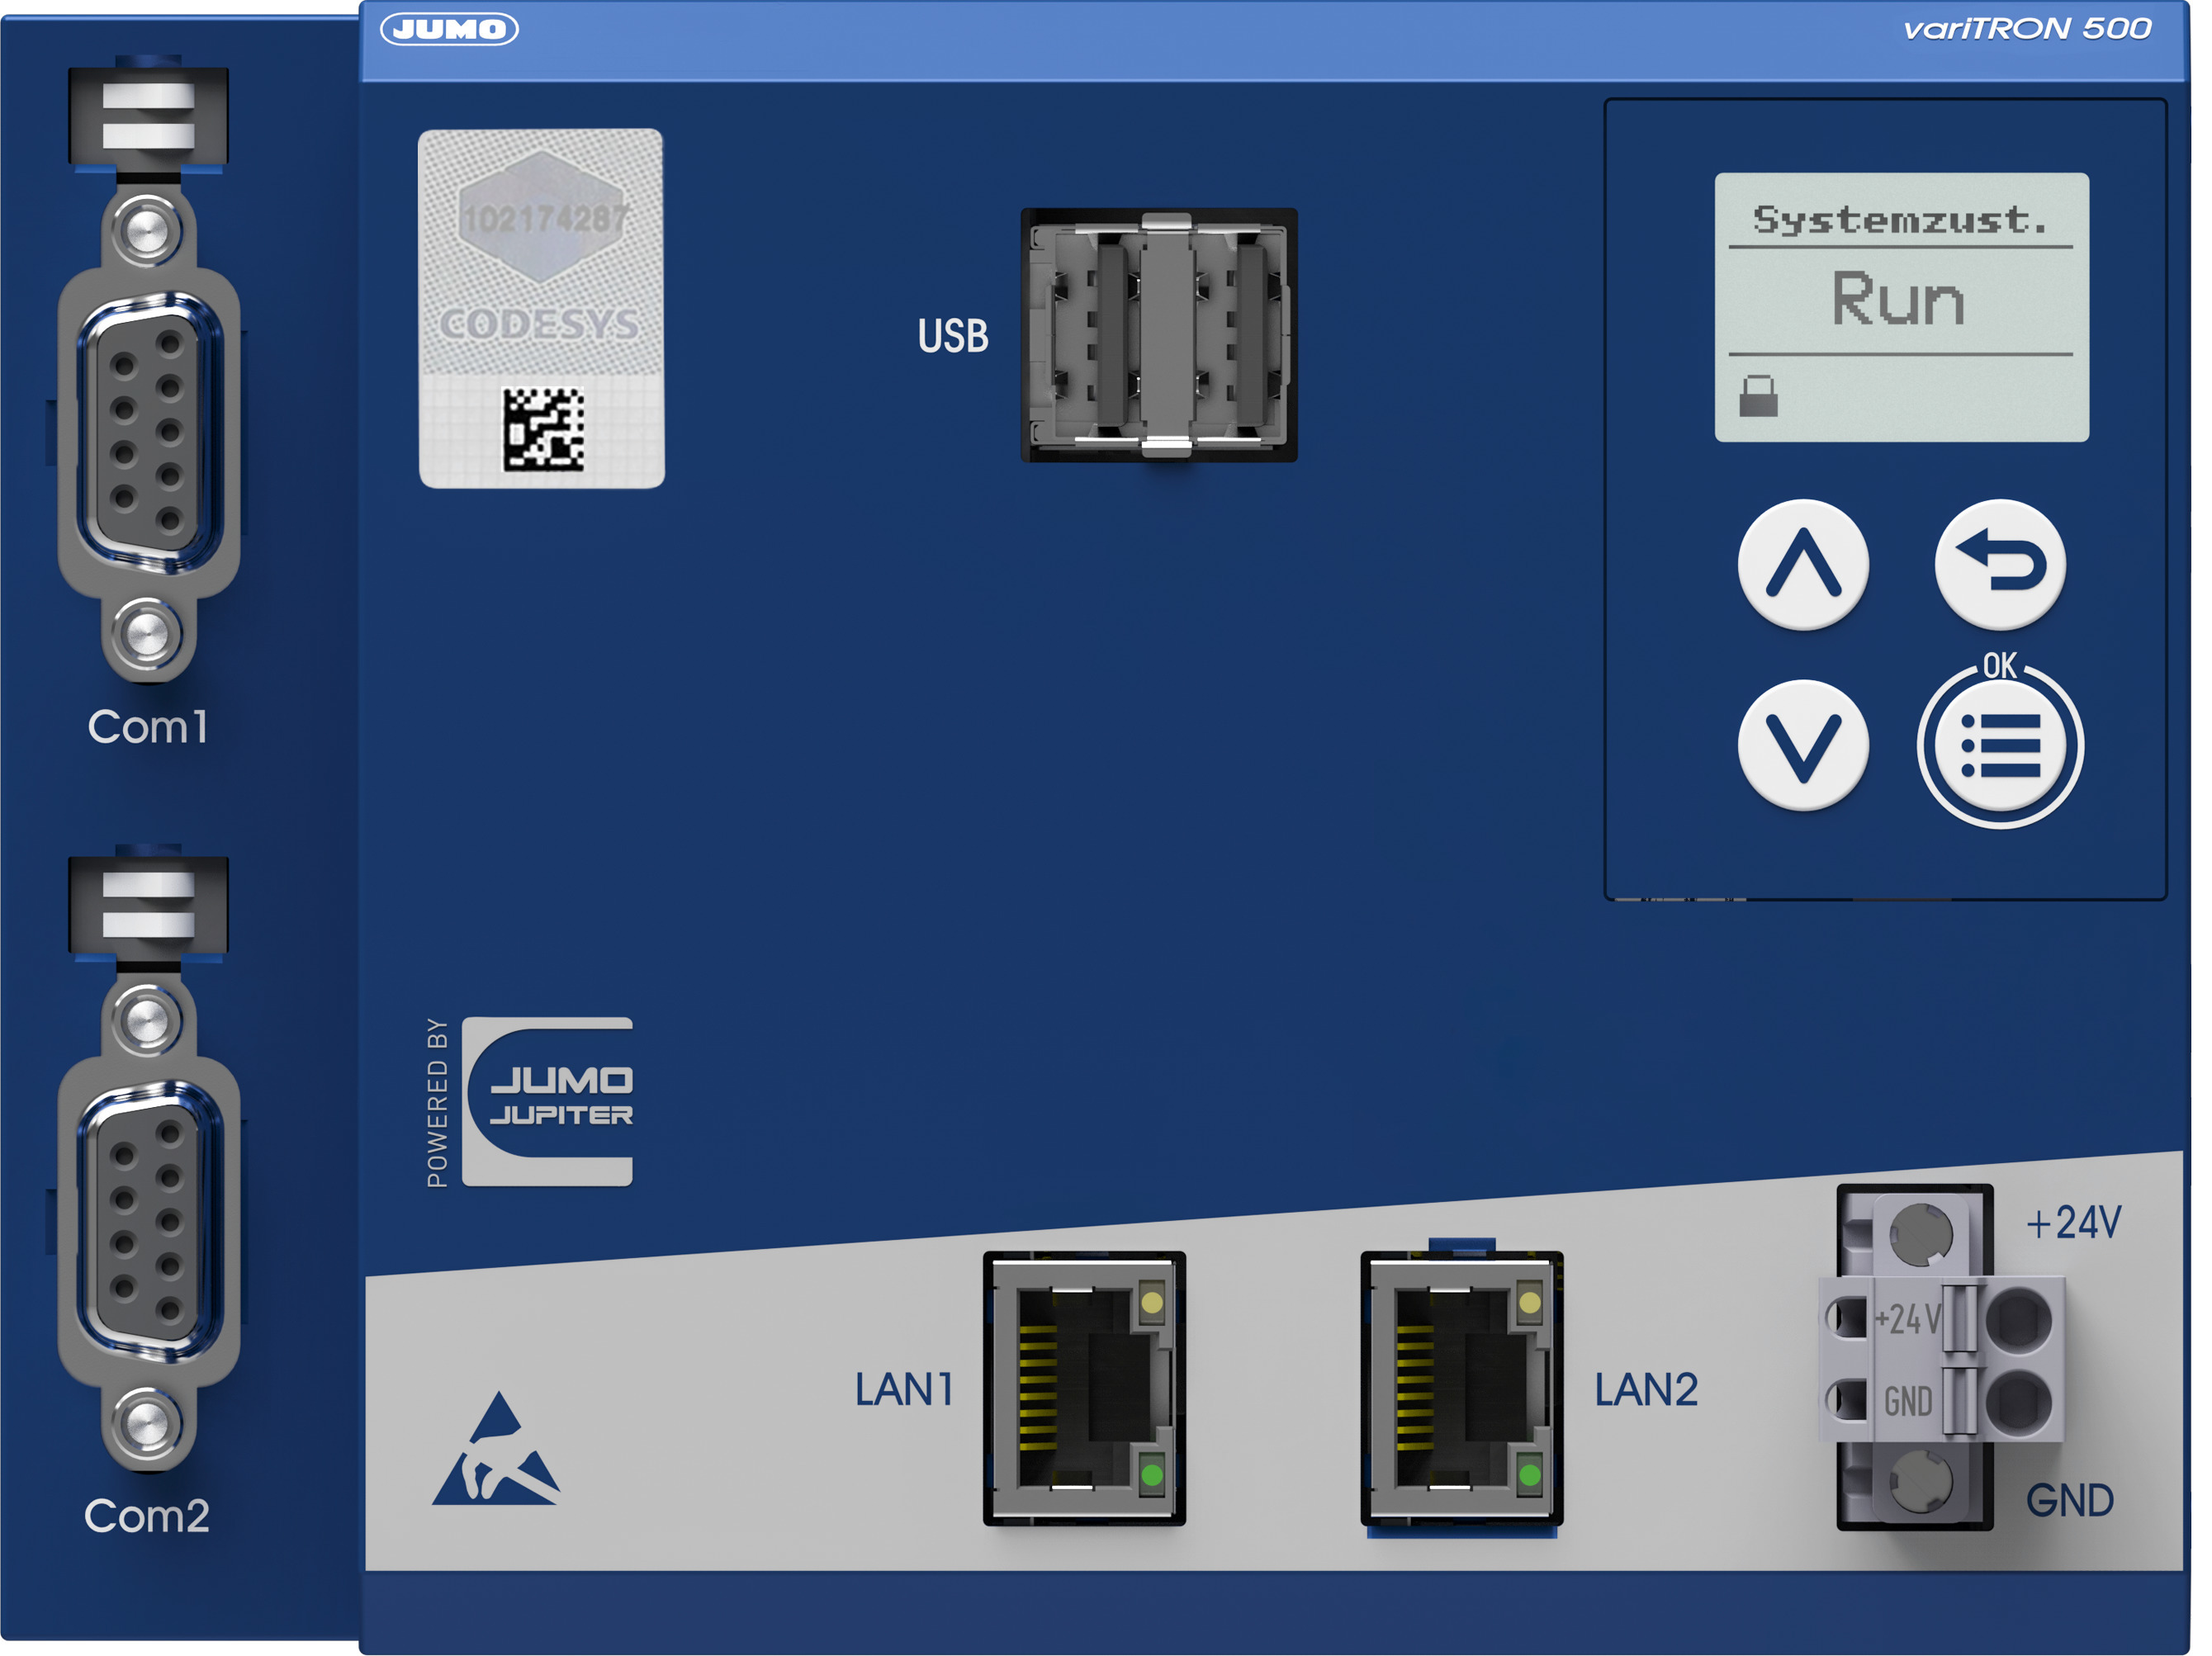 | Recording of max. 240 analog or digital signals | Live trend in the curve diagram: A maximum of 8 analog signals and 8 digital signals can be displayed per group. If there are 10 groups, a total of up to 80 analog signals and 80 digital signals are therefore possible. |
JUMO variTRON 500 touch (705004)  | Recording of max. 240 analog or digital signals | Live trend in the curve diagram: A maximum of 8 analog signals and 8 digital signals can be displayed per group. If there are 10 groups, a total of up to 80 analog signals and 80 digital signals are therefore possible. |
Group configuration
JUMO variTRON: Web Cockpit
Home / Configuration / Recorder / Groups / Group XX
All parameters required for recording and visualizing process data are specified in a group.
The following configurations are available for each group:
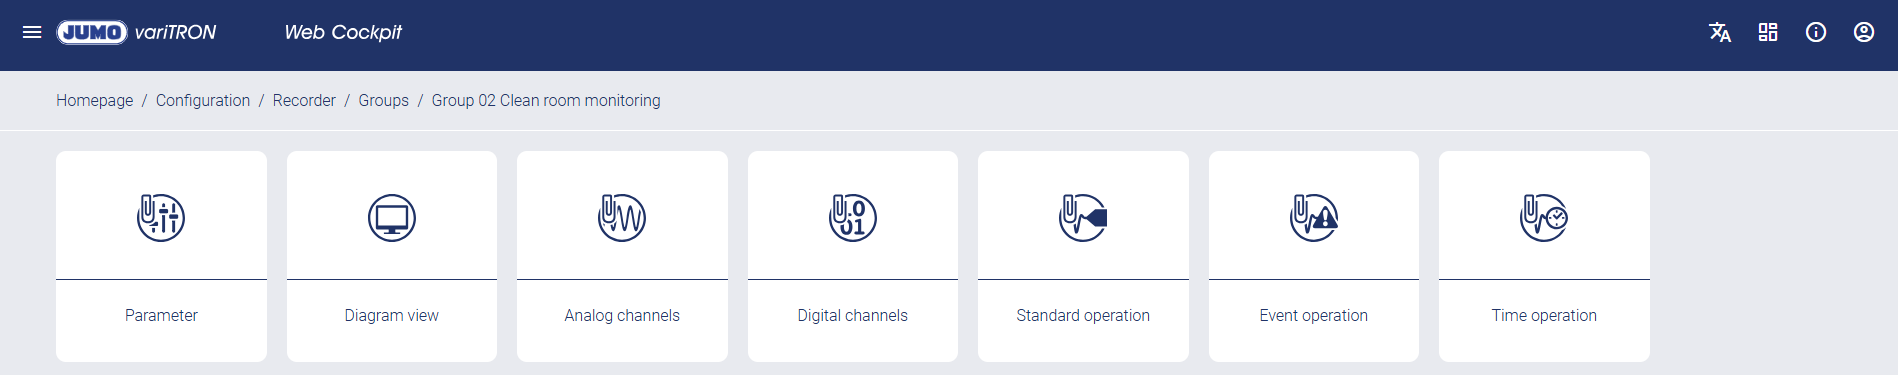
Parameter
The group name is defined and the recording method set.
There are the following setting options for the recording method:
Normal
Not only the measured value, but also metadata such as minimum value, maximum value, average value (avg.), validity (valid/invalid), measuring range underflows (under), and measuring range overflows (over) are saved.Compact
Only the current value is saved. This saves on memory capacity in both JUMO variTRON and JUMO smartWARE Evaluation.
Diagram view
The displayed measured values (min. value, max. value, current value, or average value) and the alignment of the diagram view (horizontal or vertical) are defined.
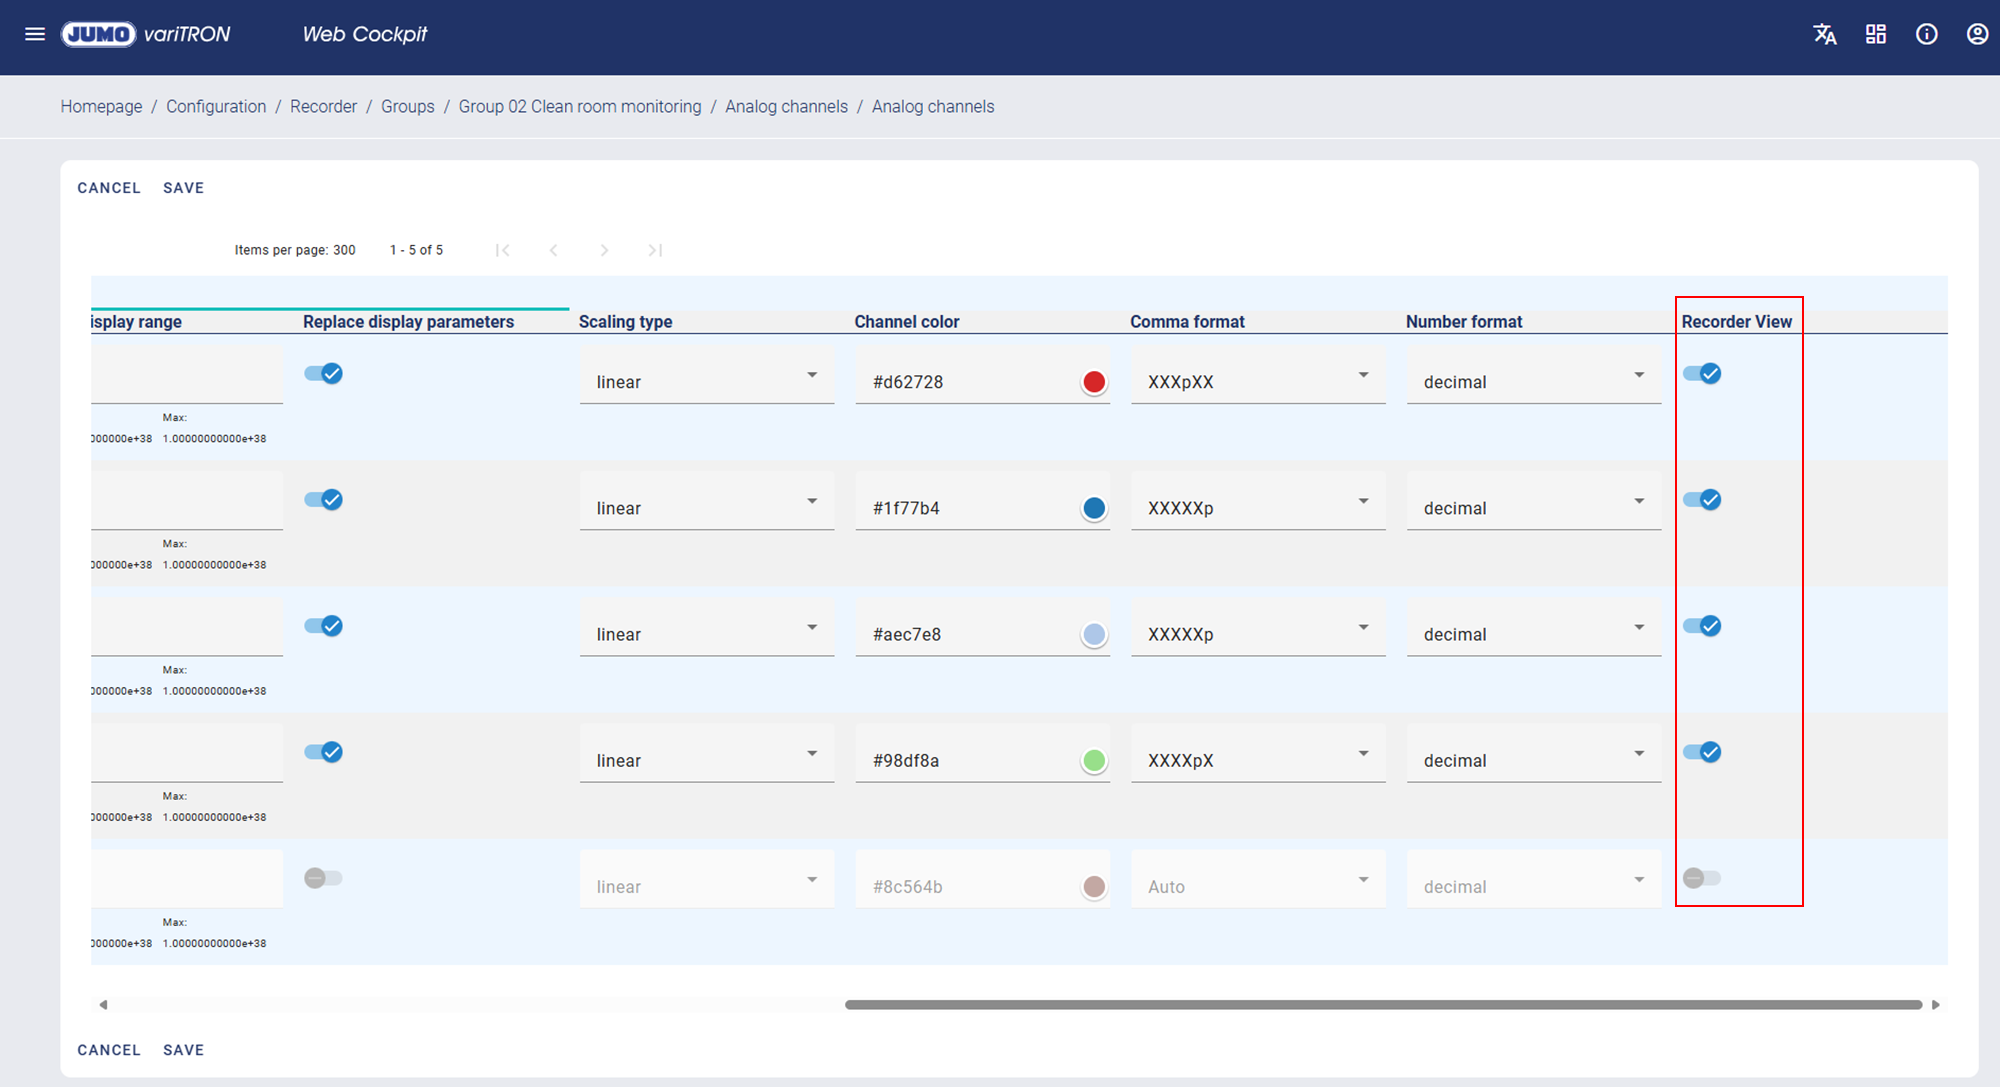
Analog and digital channels
The channels to be recorded are configured in the analog and digital channels.
Depending on the device version (features), a different number of analog and digital signals can be recorded.
The channels can be divided across various groups as desired. For example, one group with 240 analog channels or 10 groups with 24 analog channels each can be configured. The precise distribution of the channels can be freely selected. The saved signals can be visualized in JUMO smartWARE Evaluation in customizable dashboards.
Standard operation
The memory status and memory cycle are defined.
Event operation
A control signal, a post-trigger time, and the memory cycle can be defined.
Time operation
The start, the end, and the memory cycle can be defined.
Recorder app
The Recorder View is available with the extra code 276 "Recorder app".
The Recorder View enables the recorded process data to be visualized as a live trend in a curve diagram.
A maximum of 8 analog and 8 digital signals can be visualized per group. Additional signals can be saved in the group, but cannot be visualized as a live trend.
Slide the slider to the right and select the "Recorder View" to activate the Recorder View.
Display of the live trend in the curve diagram
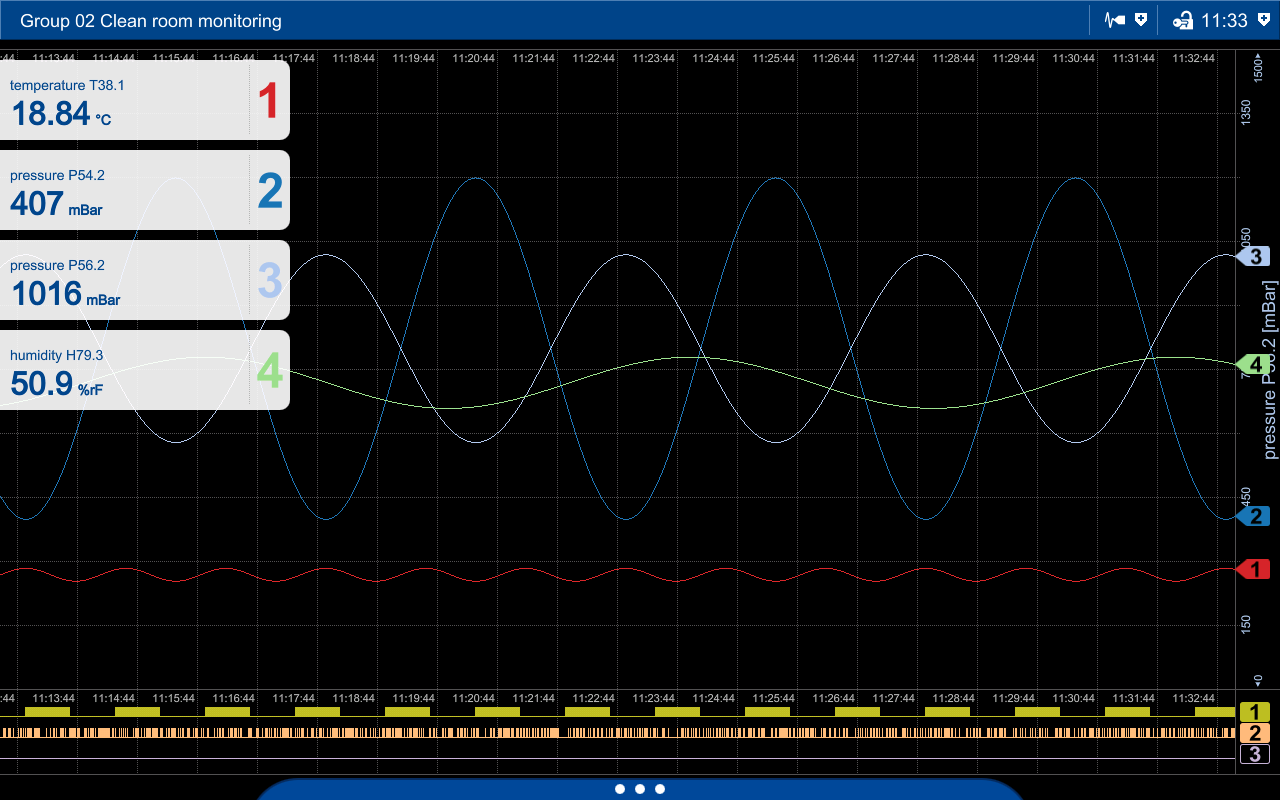
HMI (JUMO variTRON 500 touch)
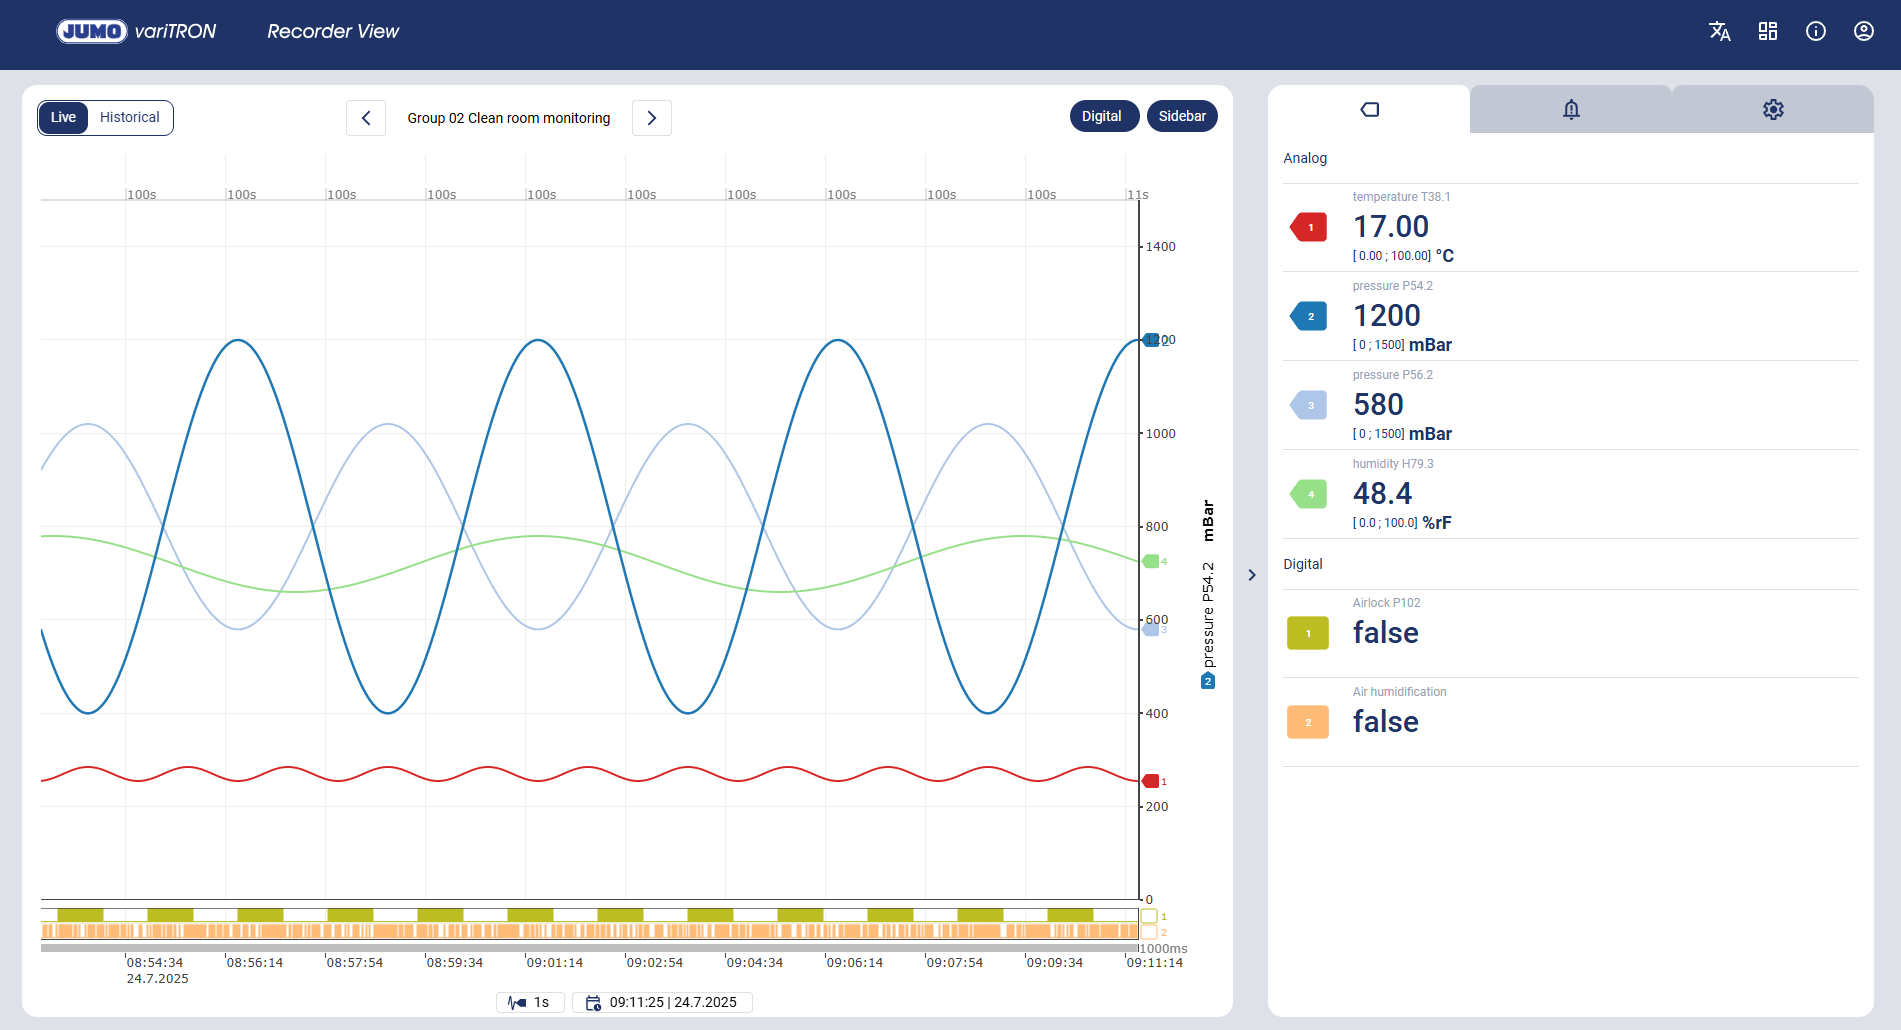
Web recorder screen (JUMO variTRON 500 touch)
In addition to visualization on the HMI, the JUMO variTRON 500 touch provides the option of displaying the recorder screen on a browser. It is displayed by calling up the device IP address in a conventional browser. The recorder screen can also be visualized on all WebGL-capable panels.
Data storage completed
Once the process data to be recorded has been configured in the relevant group, a connection to the JUMO smartWARE Evaluation Datastore must be established to save and evaluate the data there. The datastore gateway must be configured for this.