
Events widget
All events that occur in the JUMO variTRON system are saved and visualized in JUMO smartWARE Evaluation. For example, alarms, audit trail entries, errors, and other events are displayed in the event table. Extensive filter functions, such as a keyword search or a full-text search, are available.
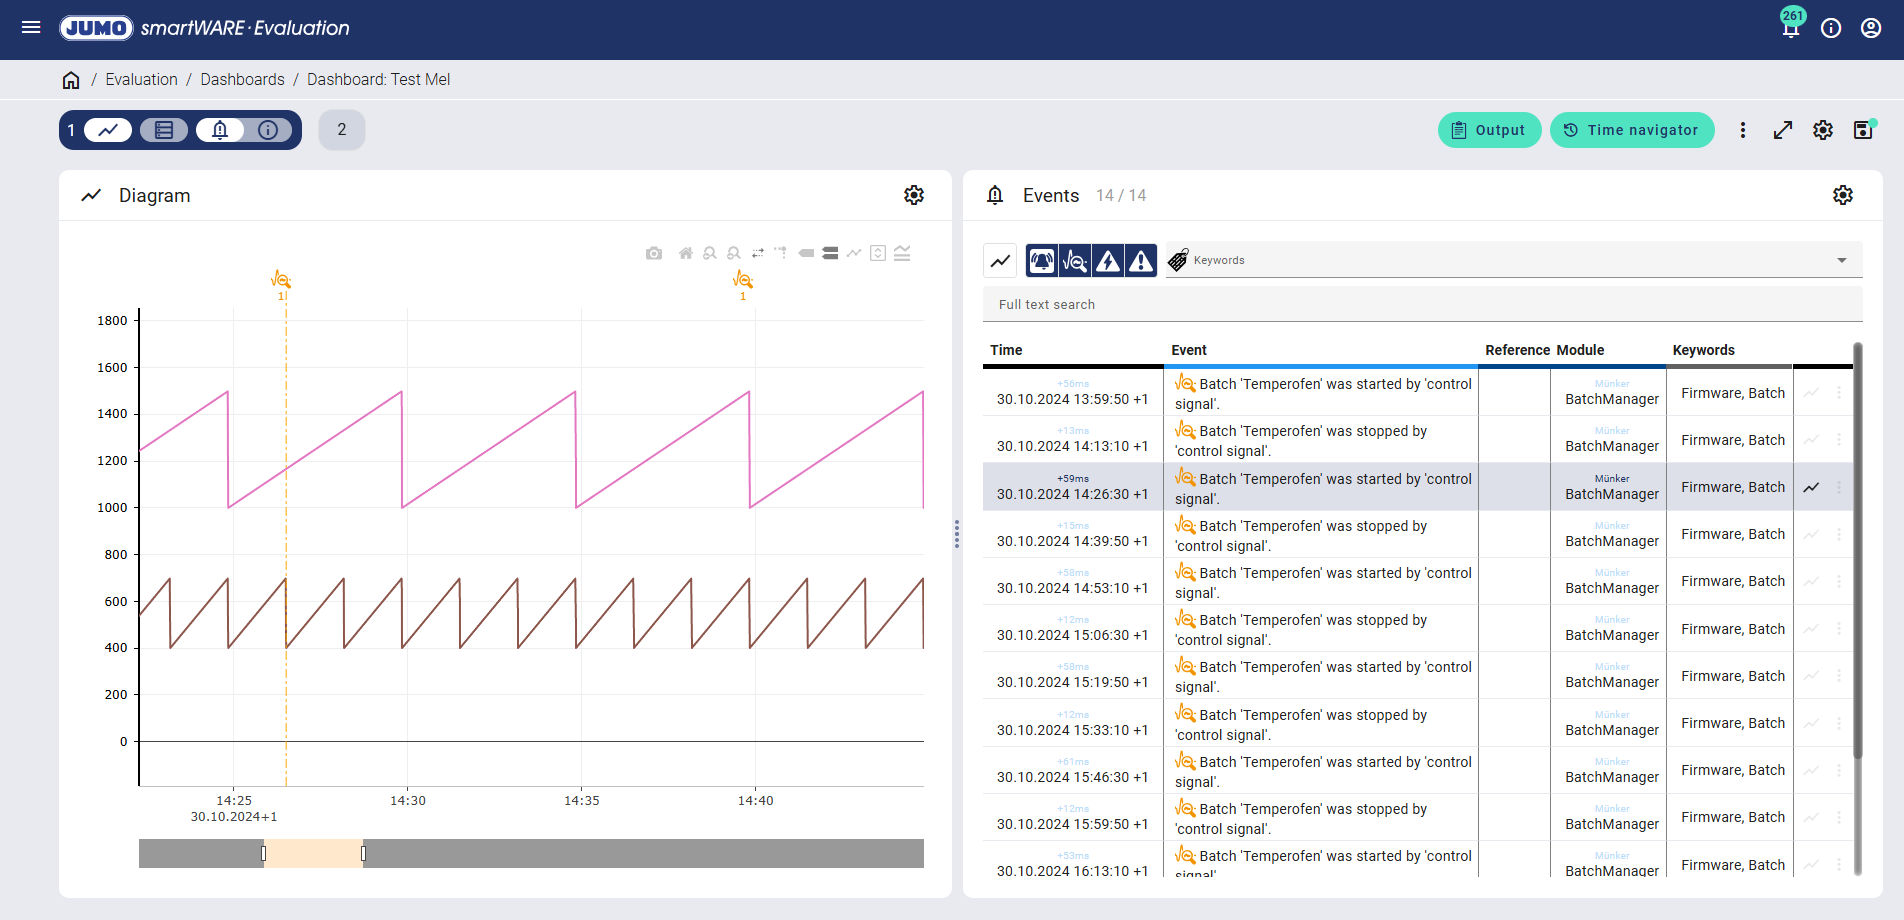
Clicking on the orange-colored "Event" icon in the diagram ensures direct assignment to the relevant entry in the event table.
If multiple events occur in a time range, the relevant number is displayed under the icon. This number may change depending on the zoom level. The displayed icon corresponds to the event with the highest priority.
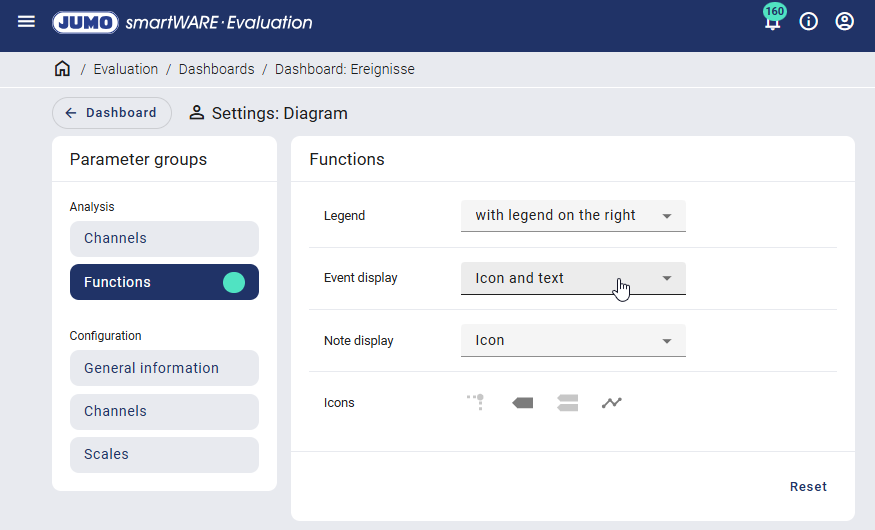
If the event display is set to "Icon and text" in the settings for the "Analysis / Functions" area, the text of the event with the highest priority is also displayed below the number.
Table columns
All events are listed in a table with the following columns:
Columns | Description | |
|---|---|---|
Time | The precise date and time at which the event occurred is specified. The number above the time stamp indicates the milliseconds. | |
Event | The event is described in more detail. An icon specifying the event type is also shown. | |
Reference | If the event occurs in connection with a certain signal, the signal is indicated. There can be multiple references. Additional information is displayed under "Other functions". | |
Analog signal The icon is displayed if there is a reference to at least one analog signal. | ||
Digital signal The icon is displayed if there is a reference to at least one digital signal. | ||
Module | The module is displayed. The device that has generated the event is given certain attributes, such as modules and keywords. The batch start or stop specified in the example was generated by the "BatchManager" module by the user "Münker". | |
Keywords | Keywords assigned to the event are listed. The device that generates the event assigns certain attributes, such as modules and keywords. | |
Columns can be hidden depending on the settings.
Other functions
Other functions can be called up using the following icons in each table row:
Icon | Function | Description |
|---|---|---|
Mark in the diagram | The event is marked in the diagram by an orange-colored dashed/dotted line. Only one marker can be set at any one time. If a second marker is set, the previously set marker is removed automatically. Clicking on the icon again removes the marker again. | |
Further details | Further information on the event's reference is displayed in a new window. The signal name, group name, and device space are specified. | |
 | Add new note | A note can be added to the event. |
Event type
Each event can be assigned to a certain event type. A corresponding icon is displayed depending on the event type: Alarms are shown in red, malfunctions, events, and information in orange.
Only one icon at a time is displayed in the diagram for each time range. The displayed icon corresponds to the event with the highest priority here.
Icon | Function | Priority |
|---|---|---|
Alarm on | 1 | |
Alarm off | 2 | |
Malfunction on | 3 | |
Malfunction off | 4 | |
Power on | 5 | |
Event on | 6 | |
Event off | 7 | |
Audit trail | 8 | |
Error | 9 | |
Acknowledge alarm | 10 | |
Acknowledge malfunction | 11 | |
Warning | 12 | |
Power off | 13 | |
Information | 14 |
Filter
The events can be filtered using the icons above the table.
Icons | Function | Description |
|---|---|---|
Limit to displayed diagram area | If this function is activated, only the events from the diagram section currently being displayed are listed. Otherwise, all events for the entire time range are displayed. | |
Alarm | All events from the "Alarm" category can be shown and hidden. | |
Audit trail | All events from the "Audit trail" category can be shown and hidden. The audit trail is used for logging processes, for example if a configuration has been changed. | |
Error | All events from the "Error" category can be shown and hidden. | |
Event | All events from the "Event" category can be shown and hidden. | |
Keywords | Filtering by keywords saved in the events can be carried out. |
A full-text search can be used to search for any text fragments. The "Event" column is searched through here.
The filter impacts how the events are displayed in the diagram.
Settings
The events view can be modified using the "Settings" icon.
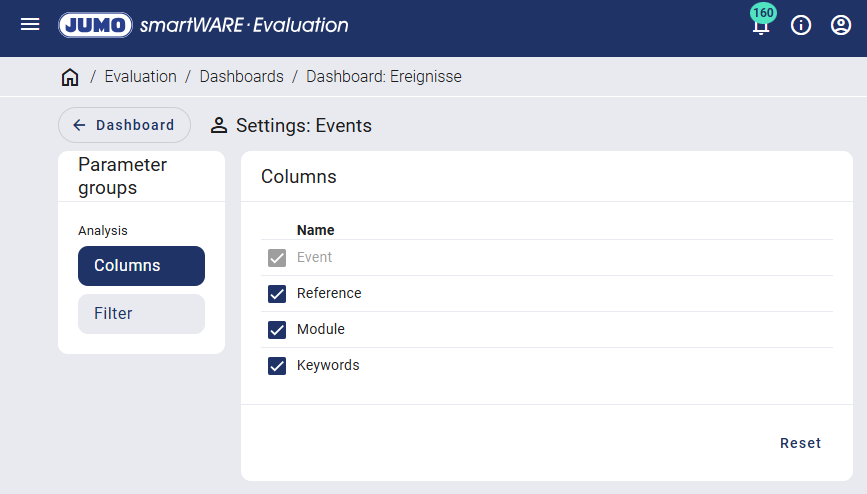
The columns to be displayed in the event table can be defined, and the events can be filtered. Changes can be undone at any time using the "Reset" button.
If changes have been made to the settings, a green dot appears after the relevant menu item. The user must switch back to the event table to save, and the changes can be saved using the "Save settings" icon.