
Diagram widget
The diagram is displayed as follows:
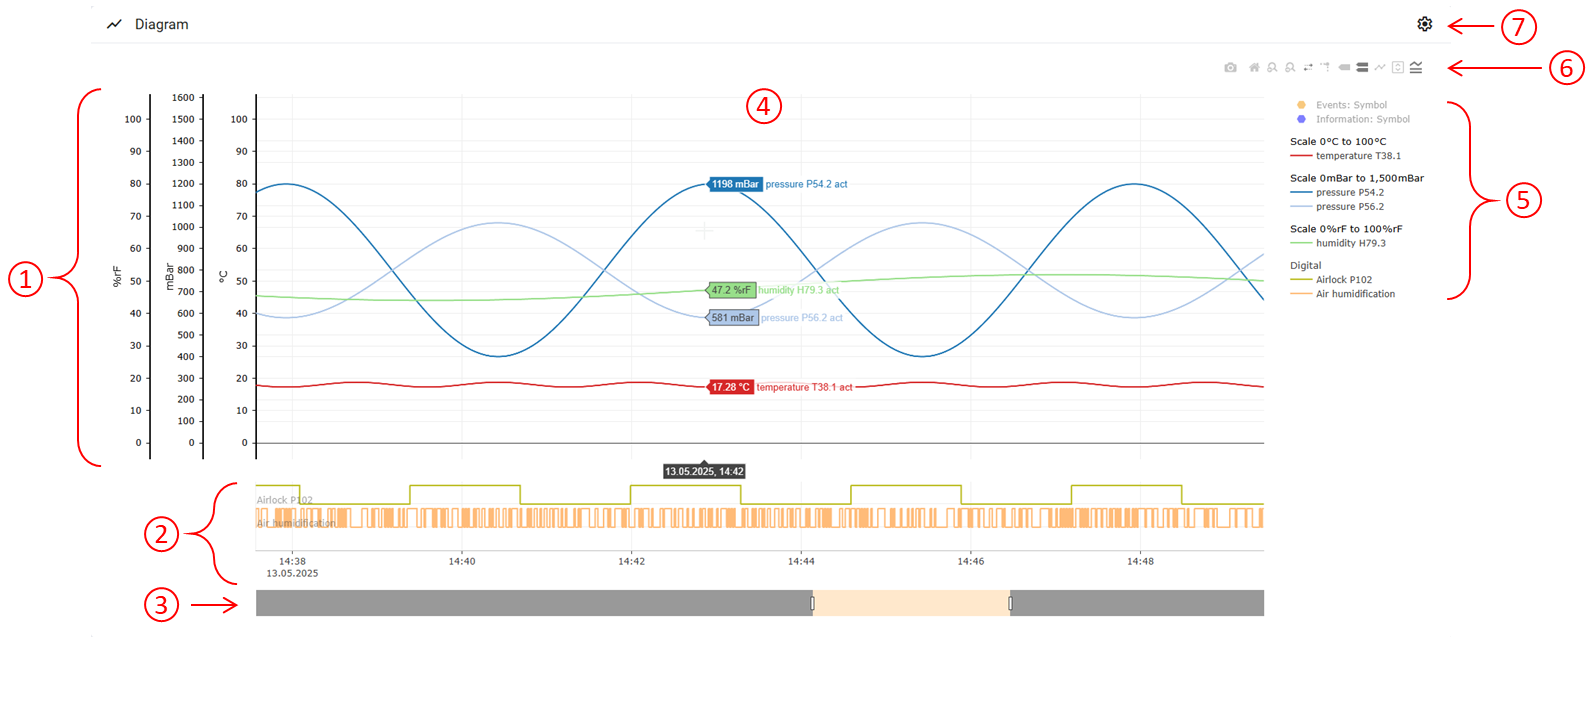
① Scale of units
Units of temperature, pressure, humidity, and air.
② Digital inputs and timeline
③ Range slider
For modifying the timeline and the curve diagram.
④ Curve diagram for the analog inputs
When hovering over the curve diagram, the live values from the individual channels including time stamp can be shown.
A note can be added by double-clicking on the diagram.
⑤ Legend with channel information
When hovering over the legend, the connected device, the relevant group, and the analog or digital channel are also displayed.
⑥ Evaluation tools
The following evaluation tools are available:
Icon | Meaning |
|---|---|
 | Download graphs as PNG |
 | Reset axes |
 | Zoom back By marking an area, the user can zoom forward in the curve diagram. The "Zoom back" icon can be used to zoom back a level. |
 | Zoom forward |
 | Switch range slider on/off To limit the timeline. |
 | Switch reference lines on/off Horizontal reference line for the scale of units and vertical reference line for timeline. |
 | Show closest data when passing over. Only the data for the nearest channel is displayed when hovering in the diagram. |
 | Move over the data to compare it. All analog or all digital values are displayed to compare them when hovering in the diagram. |
 | Show/hide process points Process points are saved measured values that are linked graphically with one another. This creates the curve diagram. |
 | Cursor movement in the diagram scrolls in the process value table |
 | Hide/show legend |
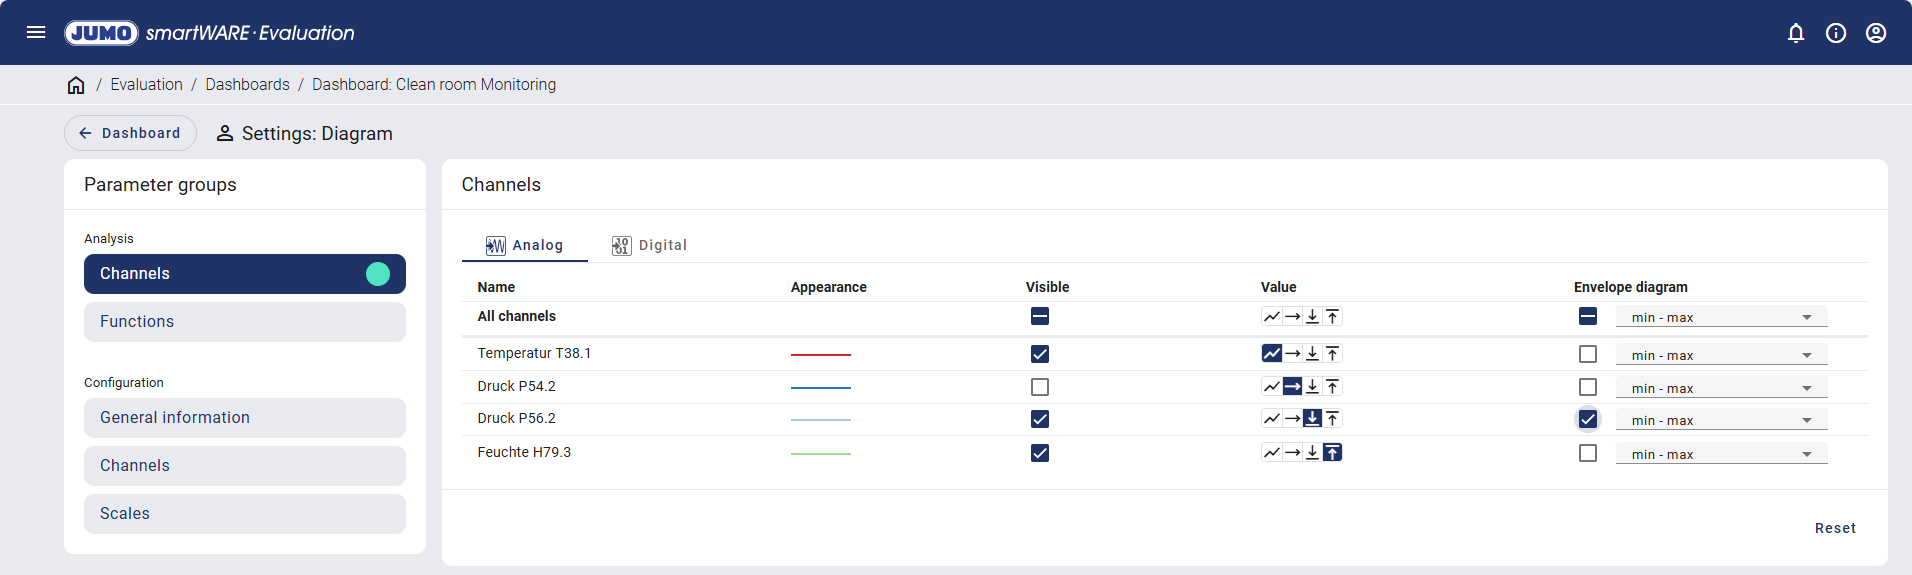
⑦ Settings: Diagram
If changes have been made to the settings, a green dot appears after the relevant menu item. The user must switch back to the diagram to save, and the changes can be saved using the "Save settings" icon.
Analysis
Channels
A distinction is made between analog and digital when setting the channels.
Analog channels:
Digital channels:
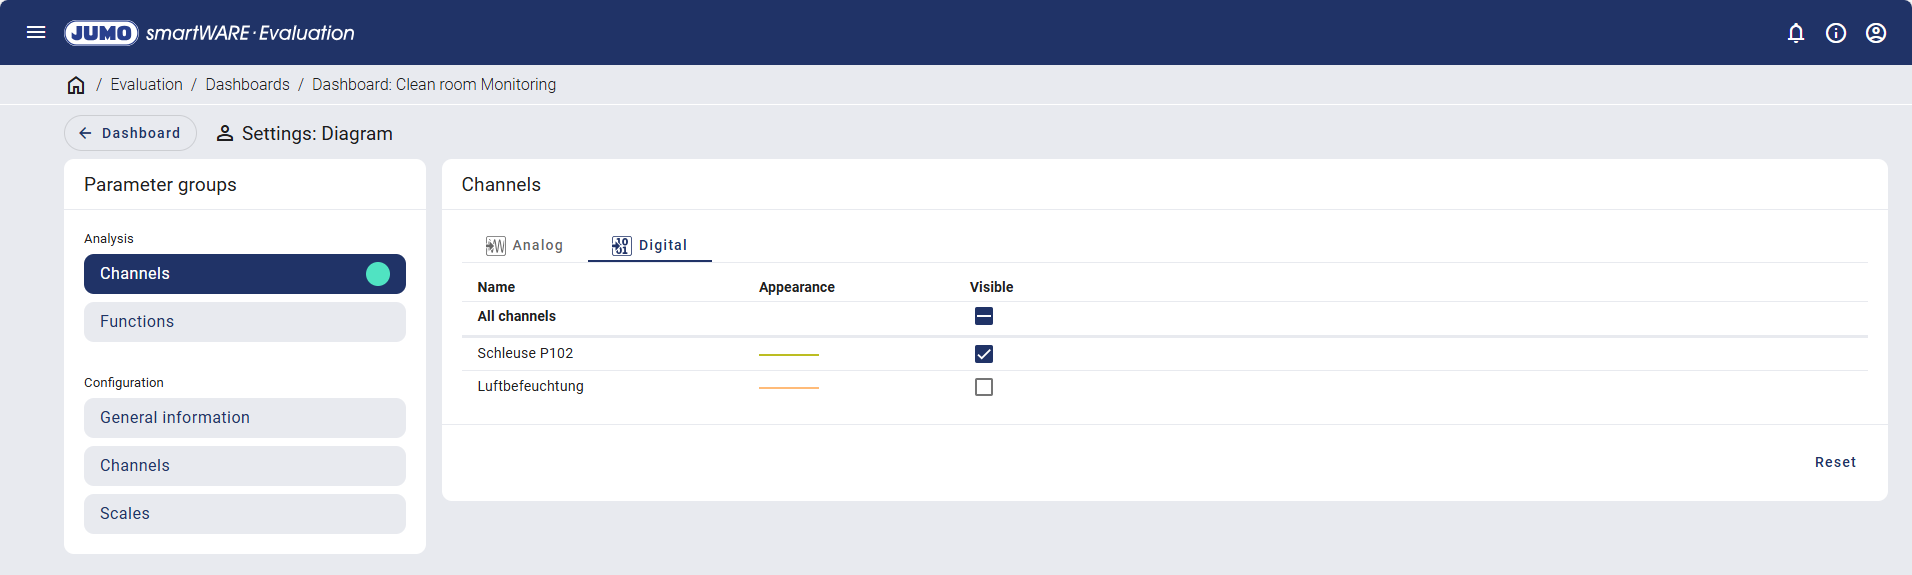
The channels are each indicated with their name and color scheme and can be switched to be visible or invisible for the process value table.
Further modifications to the displayed values can be made for the analog channels. The following values can be displayed:
Operator | Explanation | |
|---|---|---|
Current value | Value at the end of the sampling period. | |
Average value | Average of all values within the sampling period. | |
Min. value | Minimum value of all values within the sampling period. | |
Max. value | Maximum value of all values within the sampling period. | |
There is also the option of displaying an envelope diagram. You can choose between the following specifications for the envelope diagram:
min - max (minimum - maximum)
min - act (minimum - current)
min - avg (minimum - average)
akt - max (current - maximum)
avg - max (average - maximum)
The envelope diagram for Pressure P54.2 and Pressure P56.2 was activated in the following example:
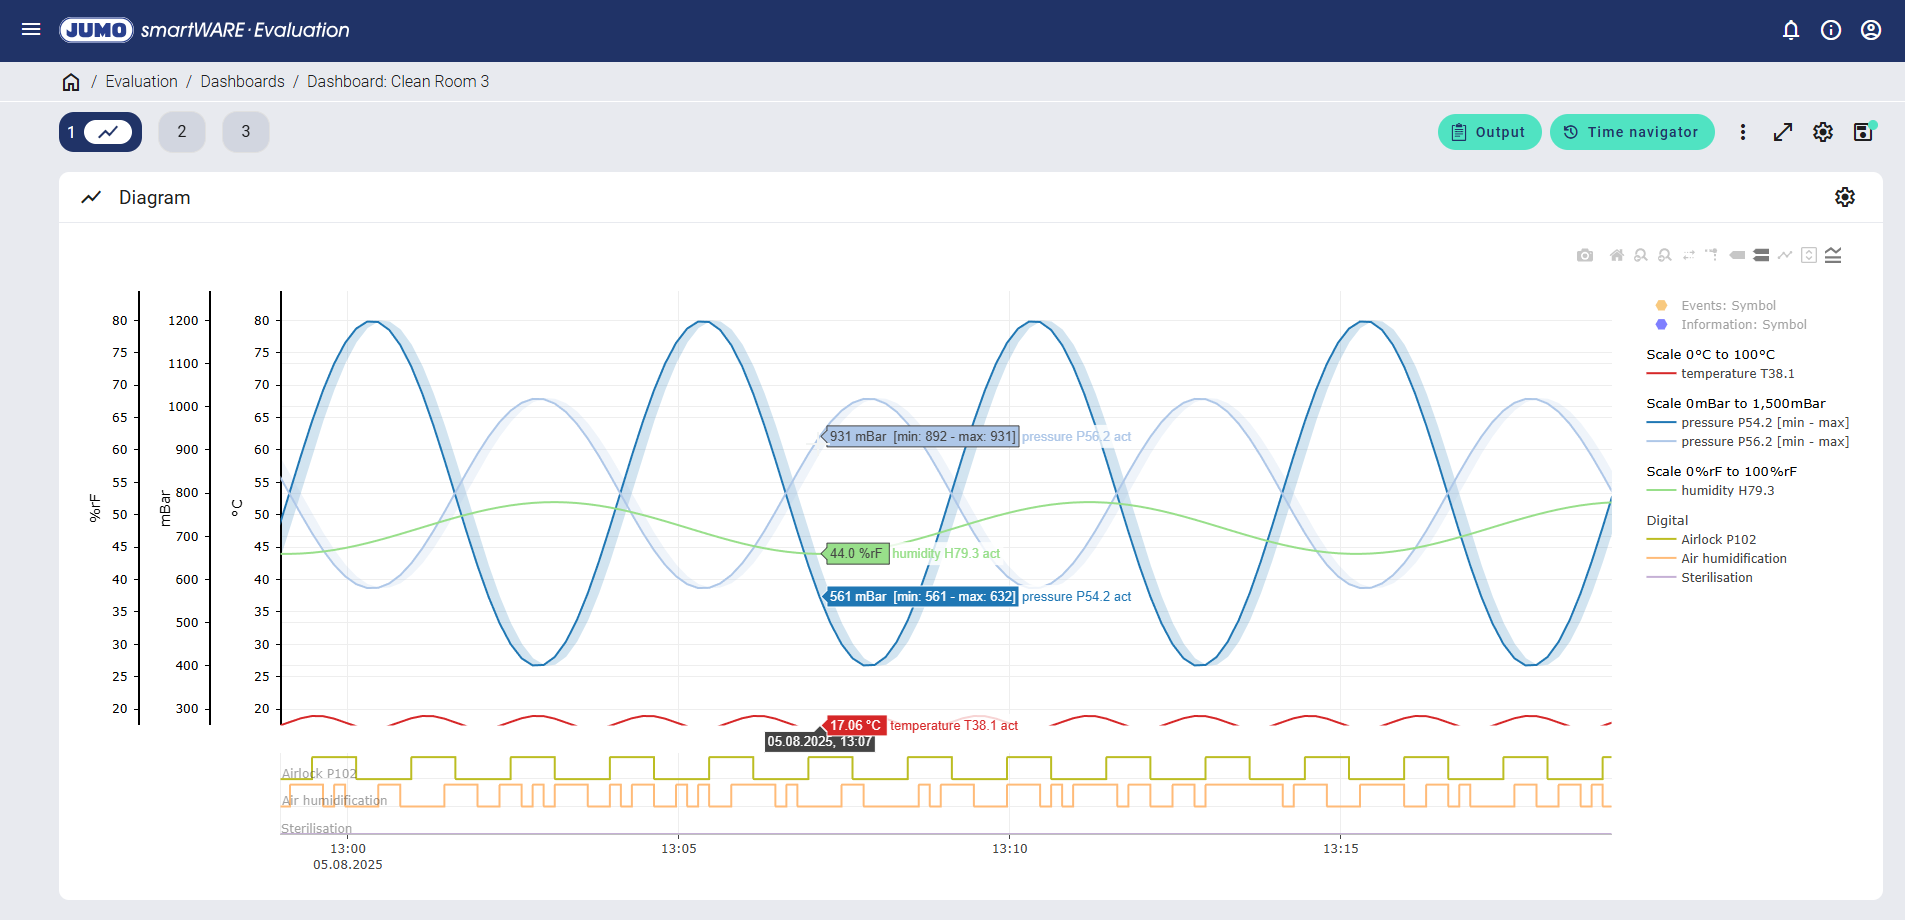
The minimum and maximum values saved for this point in time are displayed when hovering over the curve diagram. The envelope diagram with its minimum and maximum values is also shown in a pale shade of the channel color.
Functions
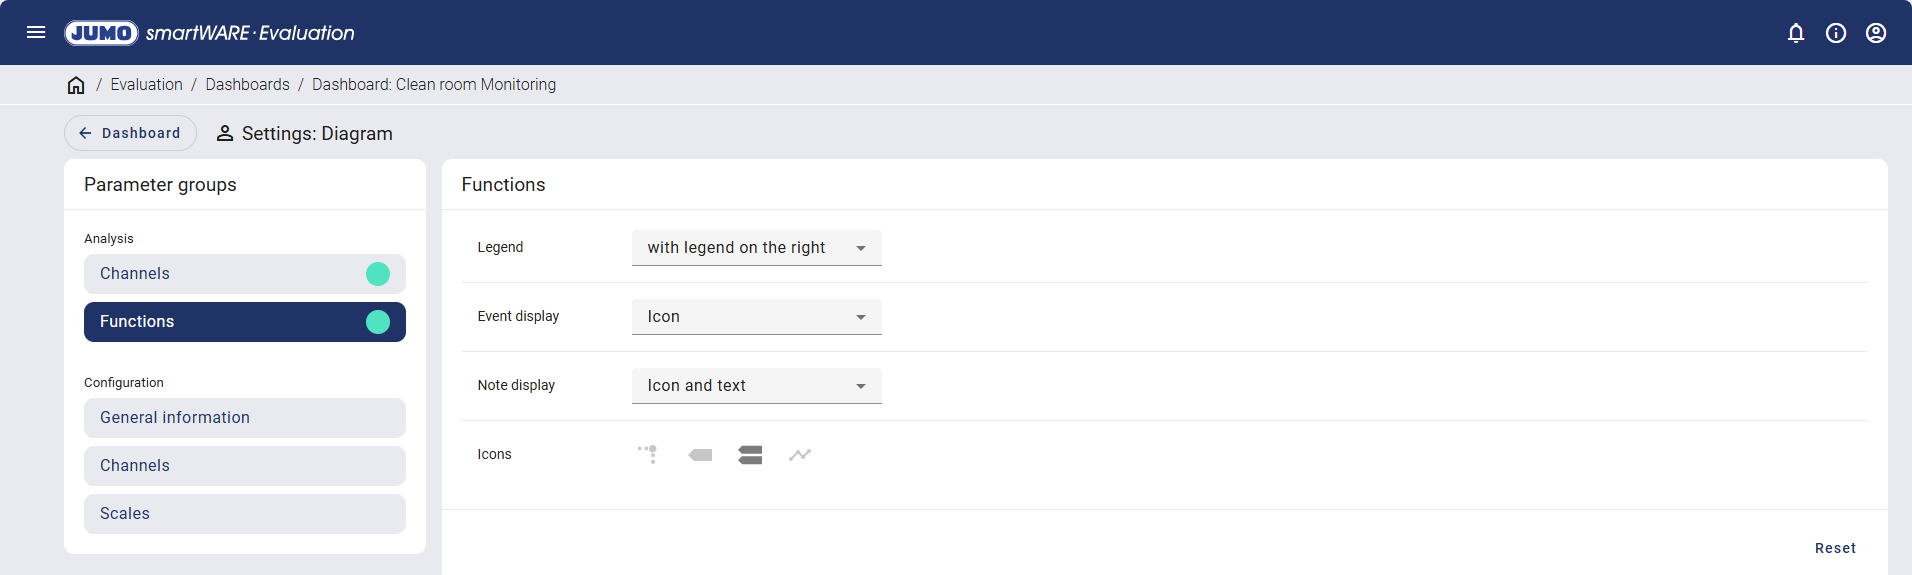
The positioning of the legend, the appearance of event and notes, and the permanently activated evaluation tools are set under the functions.
Configuration
General information
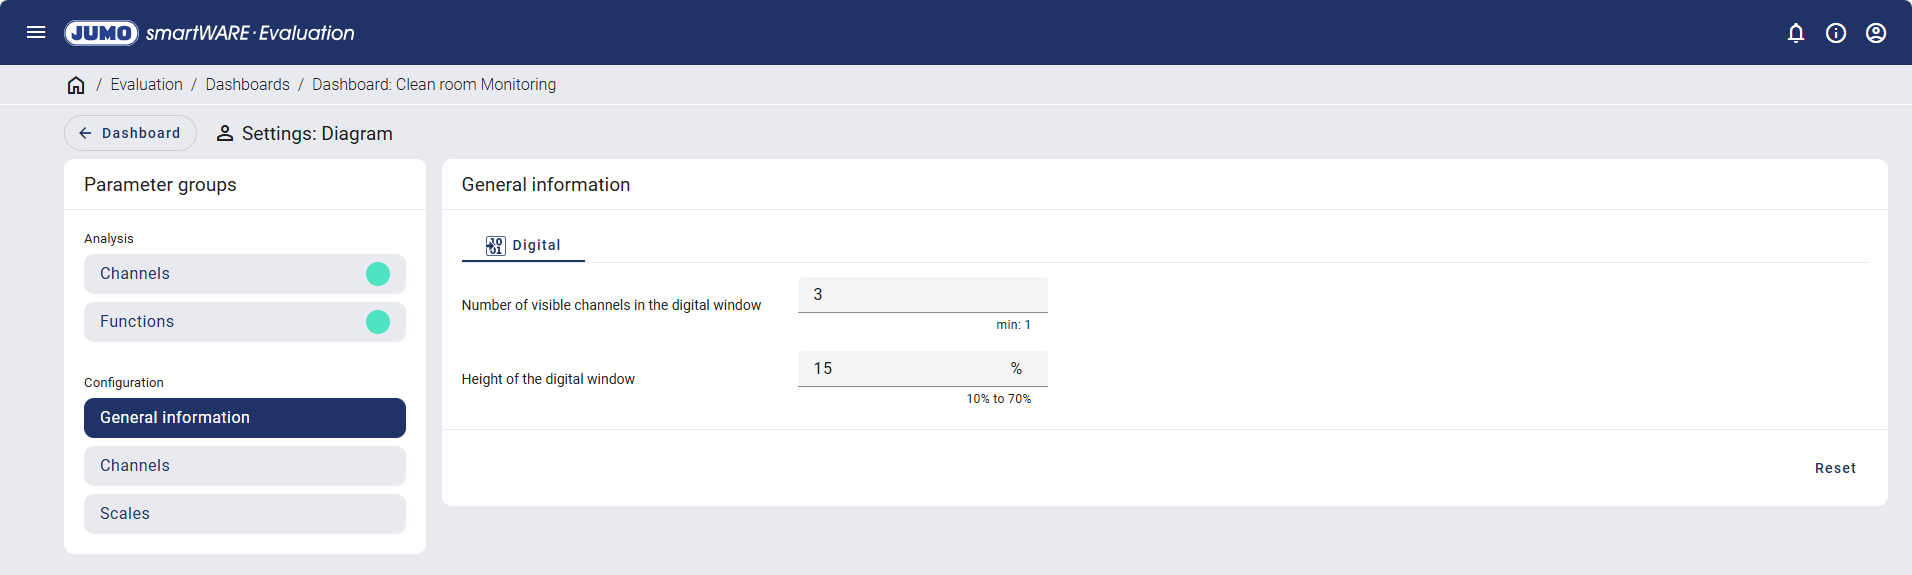
The number of visible channels in the digital window and the height of the digital window can be set for digital channels.
Channels
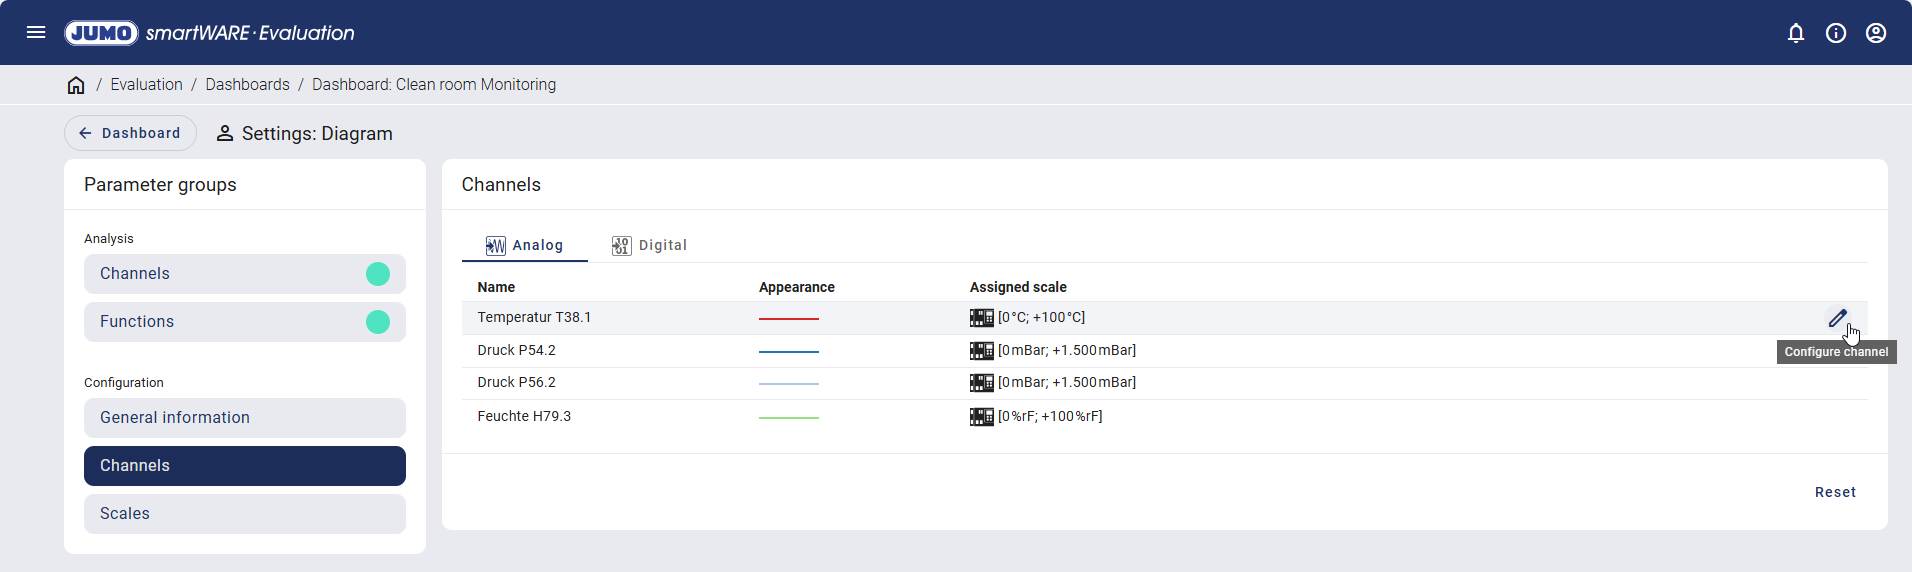
The analog and digital channels are each indicated with their name and color scheme. The assigned scale is also shown for each analog output. The "Configure channel" icon appears on the right-hand side when hovering over a line.
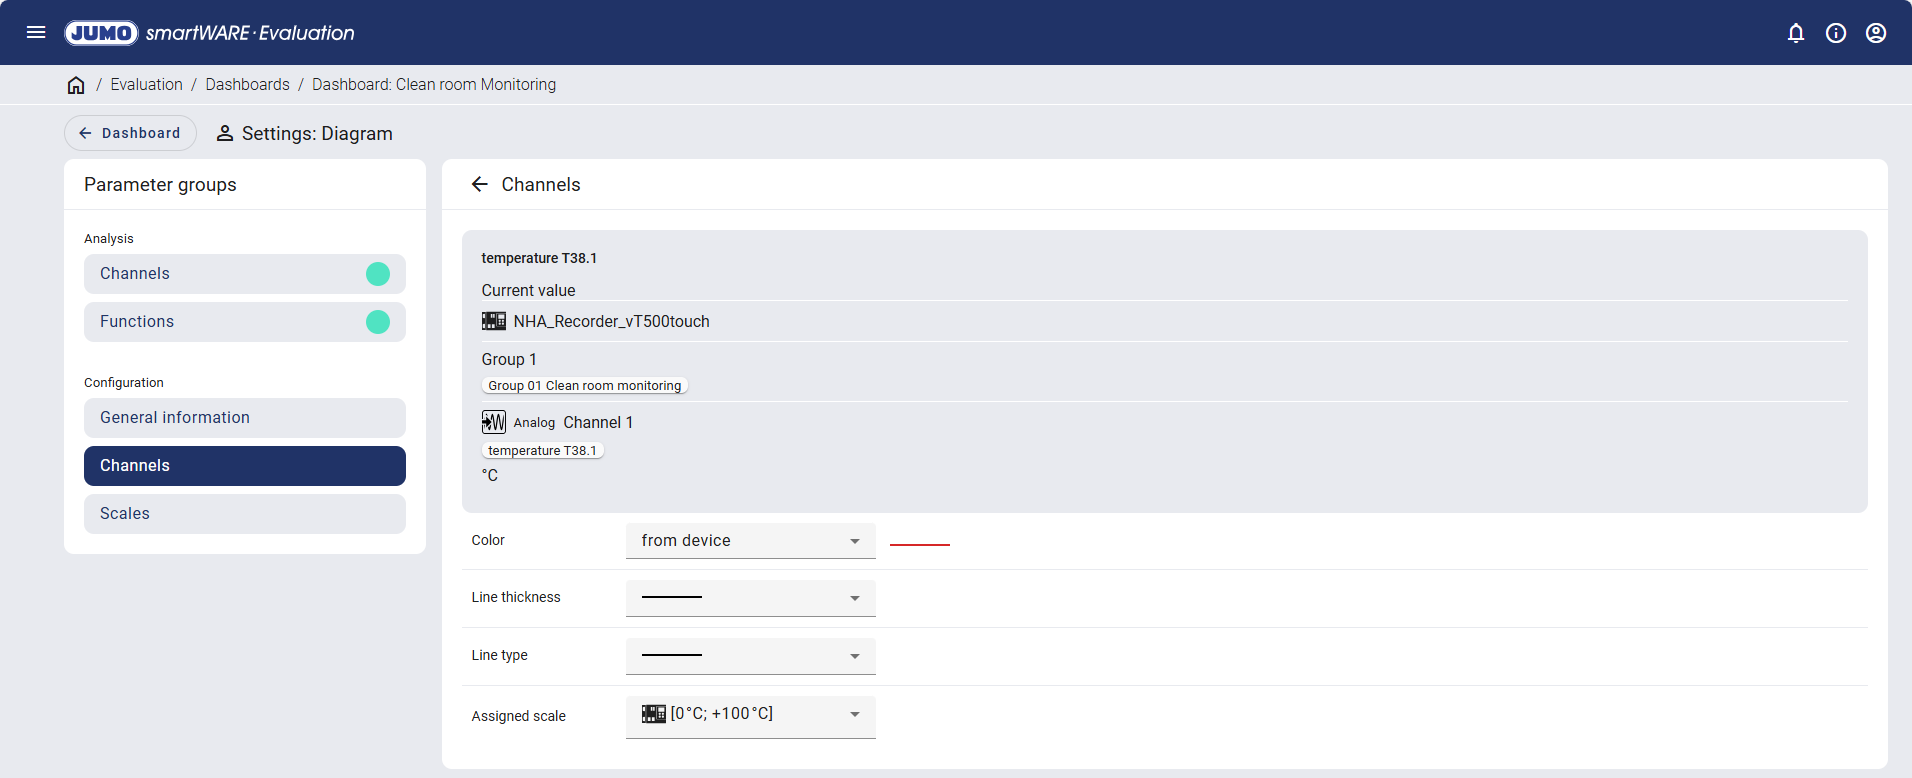
The color, line thickness, line type, and assigned scale can be modified here.
Scales
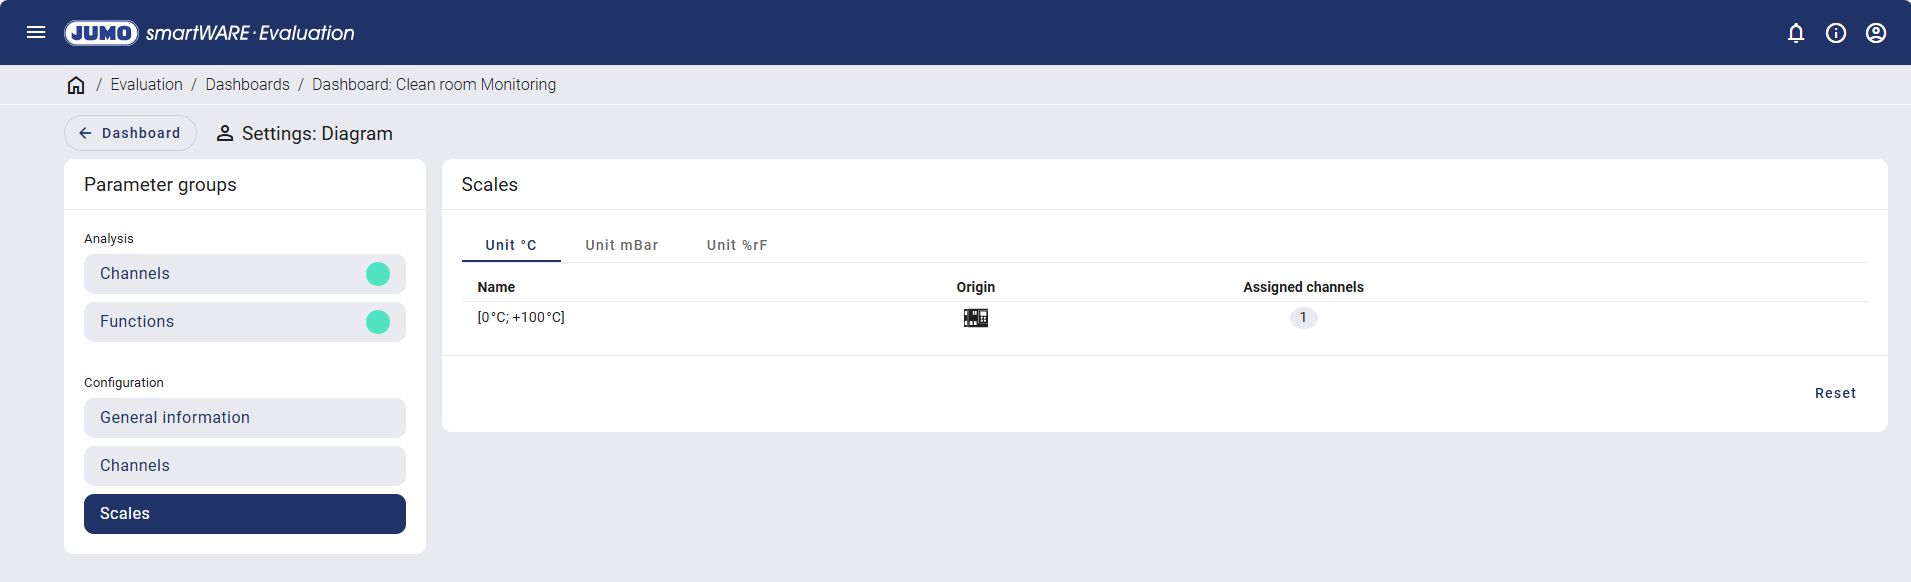
Under scales, the units are displayed with their name, origin, and number of assigned channels.