Is data exported to the Datastore?
Evaluation / Datastore / Devices / Tab sheet: "System/Device Overview"
If the required device is displayed in the list, data is exported to the Datastore.
Is the data exported regularly? Are process data / batch data / events also included?
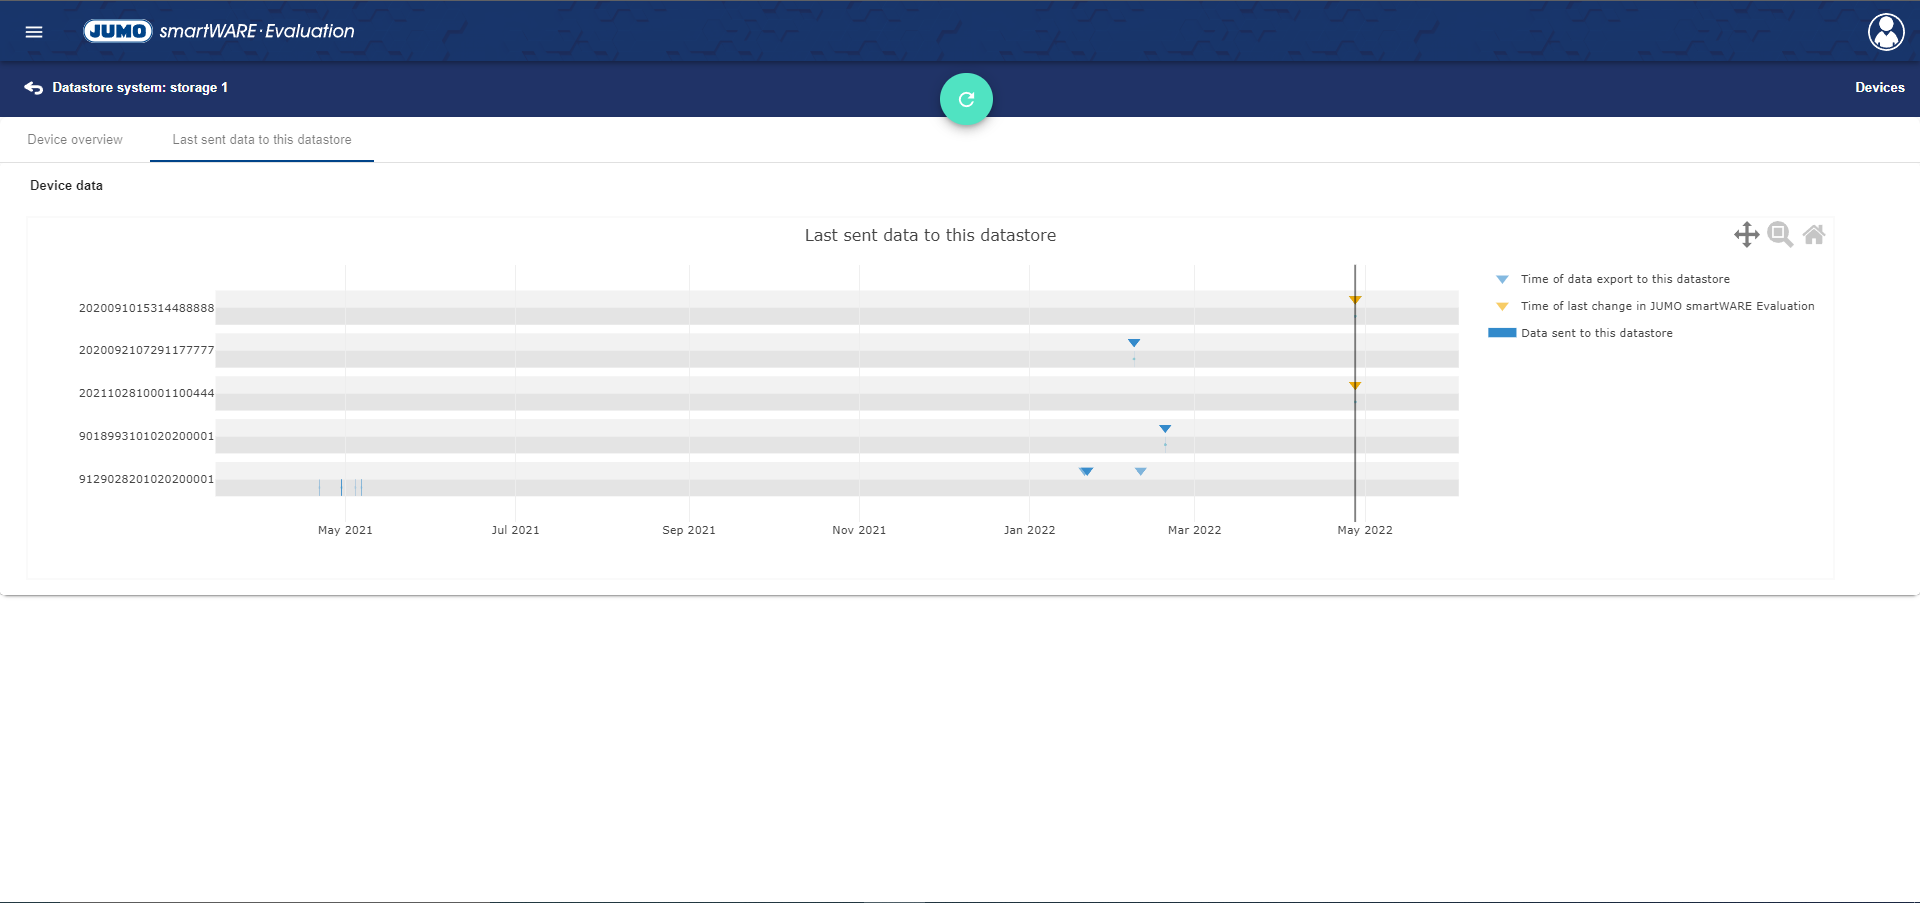
Evaluation / Datastore / Devices / Tab sheet: "Last data sent to this Datastore"
The tab sheet "Last data sent to this Datastore" provides an overview of the data to be exported.

How do I set up a device that forwards data to smartWARE Evaluation?
Evaluation / System/Device Overview / Editing
The required device can be added to an installation using drag & drop. After saving the configuration, the device forwards data to the smartWARE Evaluation.
Which time period do I want to cover in the evaluation?
Evaluation / Evaluation Time Range
In the Evaluation time range area, the global time range can be adjusted. If there are several devices, there is also an option to define an individual time range.
The setting "Time range to end of data" is recommended.
Can the data be processed in the evaluation?
Evaluation / Service / Data Status / Tab sheet "Evaluable process data"
In the tab sheet "Evaluable process data", you can check if process data is available for a certain area. Processing time may be longer for larger amounts of data.
How do I display process data in a chart?
Evaluation / Dashboards / New
In smartWARE Evaluation, the process data is displayed via Dashboards. One or more channels of a device can be evaluated on a Dashboard. The time period to be displayed on the chart can also be specified. The setting "Time range to end of data" is recommended here. Querying the data takes more time for larger amounts of data.
The Dashboard is now called up via the "Evaluation" button and can subsequently be called up via the "Evaluation" menu item in the main menu.
The chart is displayed in the evaluation. How do I show a different time range in the chart?
The time range of a chart can be adjusted via the Time Navigator. This can be moved, enlarged or reduced. Clicking "Apply time range" saves the time range.
How do I display the data of a batch?
Evaluation / Batches
If there is a large number of existing batches, it is useful to limit the selection using the filter feature.
In the evaluation, the batch data is displayed using a Dashboard that was created in advance. The Dashboards with the most channel matches are displayed first.
If the process data of the batches has not yet been processed, preference is given to processing this area when the evaluation is called up.
The display of data in the evaluation is limited to the time range of the batch (regardless of the definition of the time range in the Dashboard).
