
Homepage
JUMO smartWARE Evaluation can be called up in all supported browsers. You access the JUMO smartWARE Evaluation instance by entering the address (URL that was set up in the JUMO variTRON Web Cockpit under "Home / Configuration / Datastore gateway / Datastore interface").
In the case of installation on a Windows® desktop PC, JUMO smartWARE Evaluation can be called up by entering "localhost".

The homepage is displayed once the instance is called up.
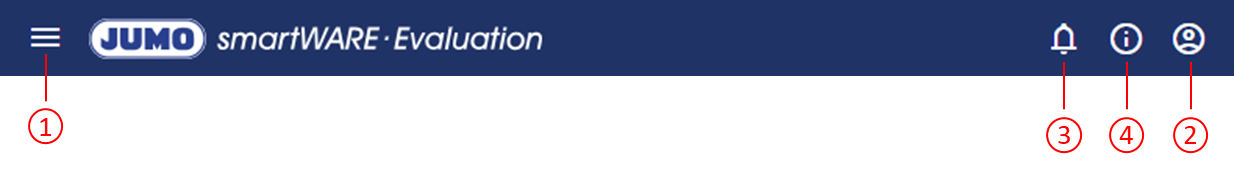
The upper area of the user interface always contains the following icons, which enable access to the relevant menus:
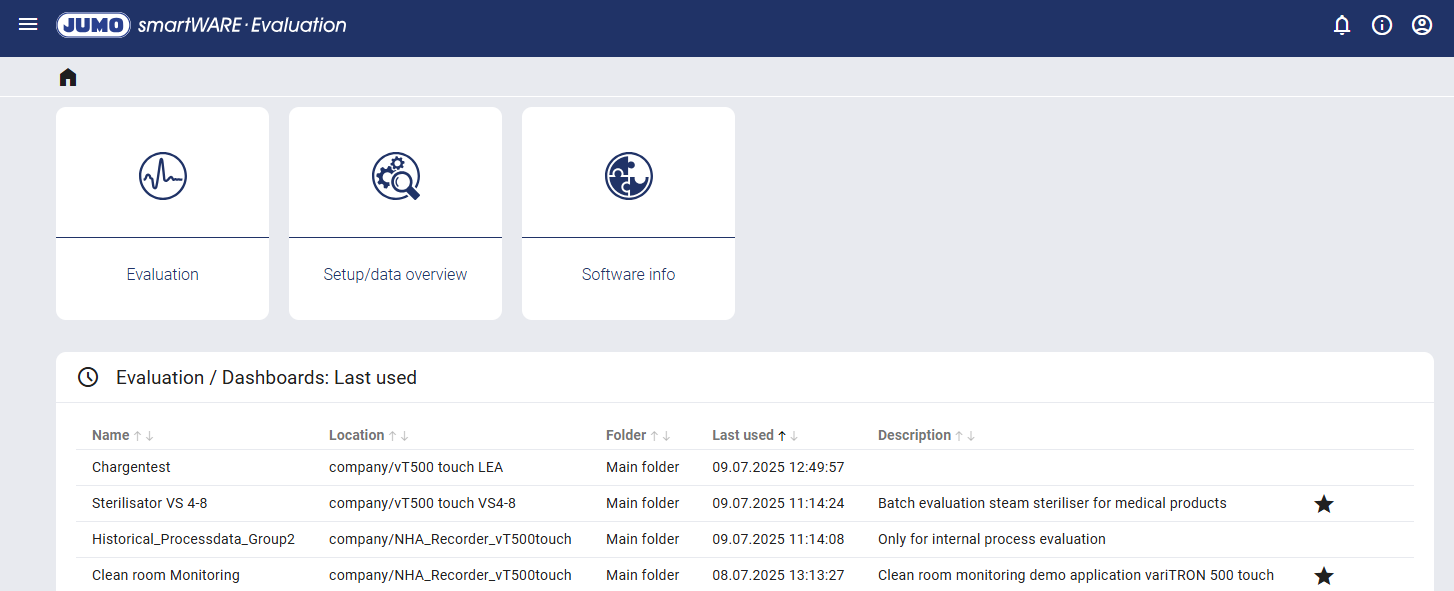
After logon, three main menus are displayed under this area. Clicking on the respective tile opens the relevant view with the associated information.
Evaluation
Customizable dashboards, batches, and reports can be evaluated.Setup/data overview
The user can make all necessary settings such as creating new plants or devices, creating dashboards, defining time ranges, adding new users, and other configurations.Software info
The software info provides information about the setup and includes a link to the current documentation (Wiki).
The last used dashboards are then listed in a table. The dashboards can be sorted in ascending or descending order according to various criteria.
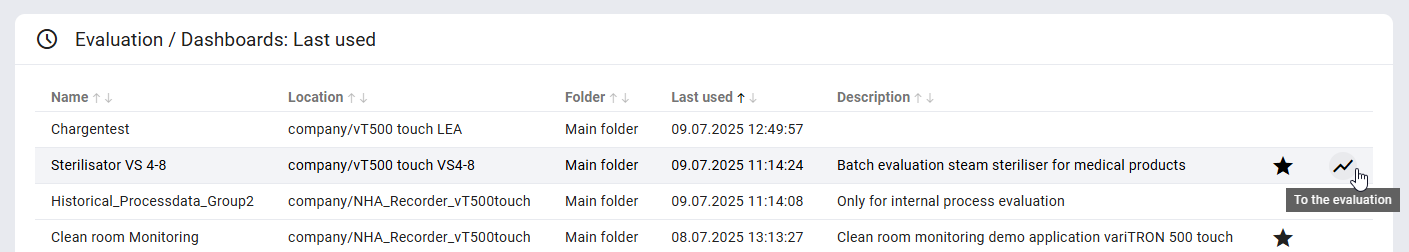
The relevant dashboards can be added to or removed from favorites using the star.
Favorites enable the user to directly access the most important dashboards.
Clicking a dashboard highlights it in color. The "To the evaluation" icon, which is used to call up the dashboard, appears on the right-hand side.