
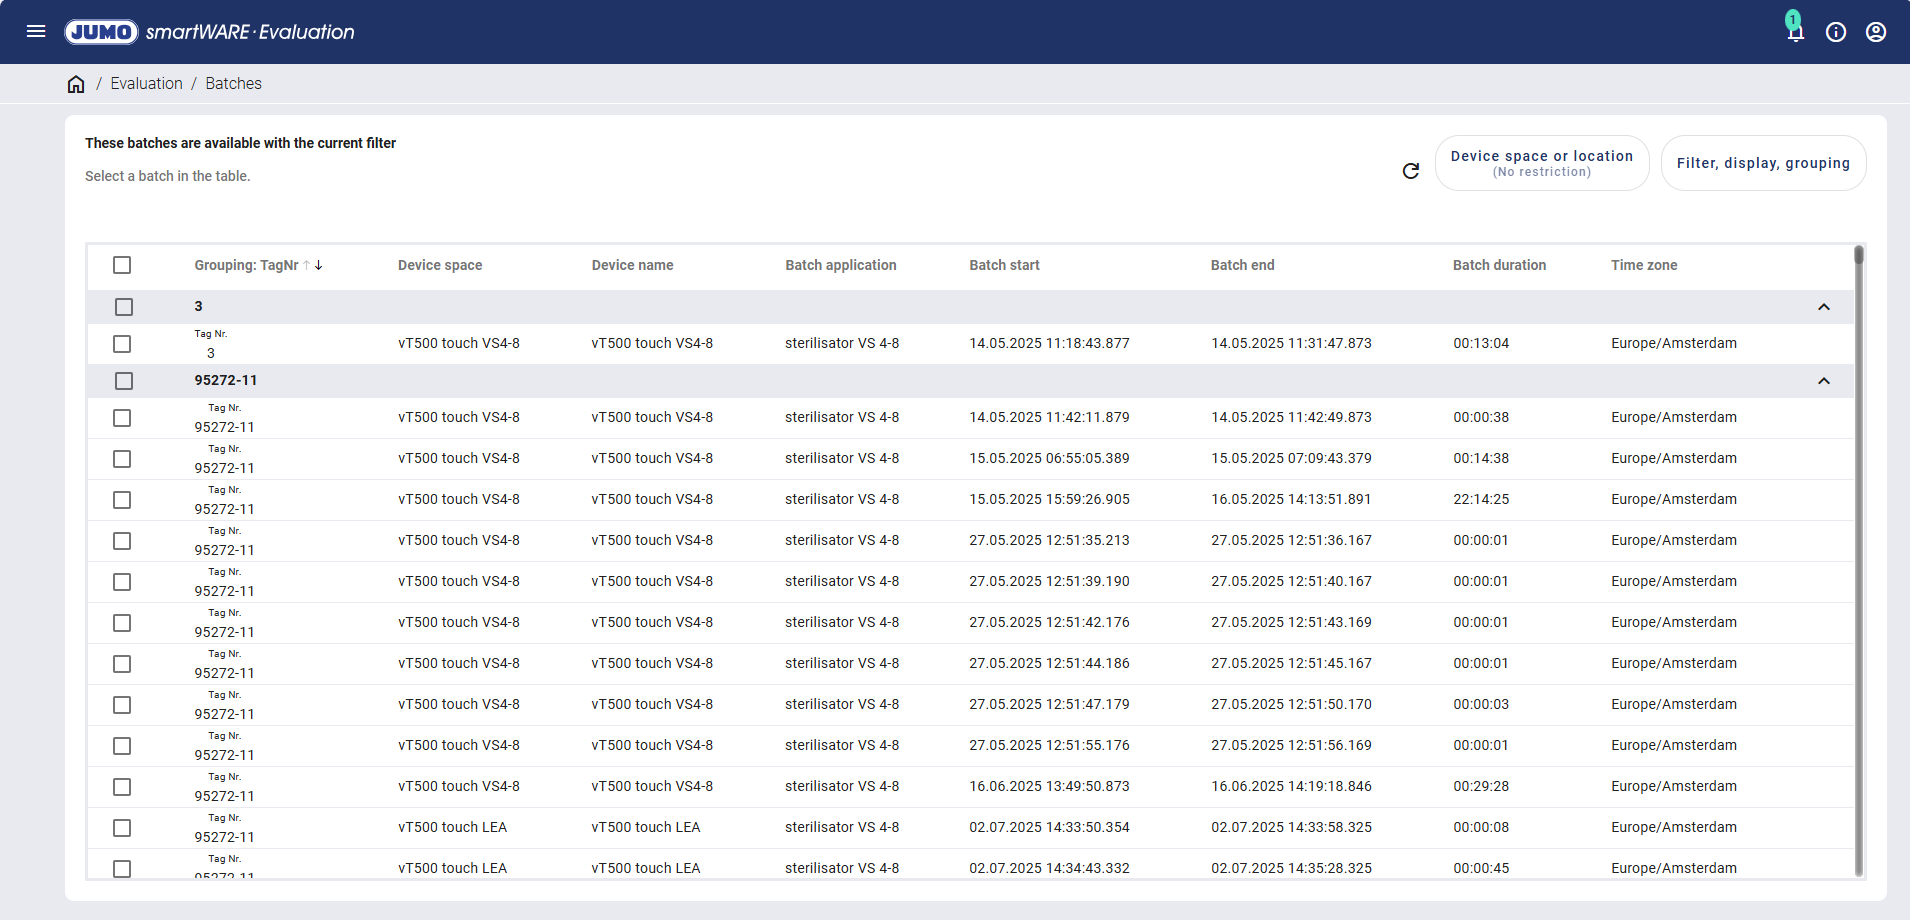
Batch overview
All completed batches from the JUMO variTRON systems integrated in JUMO smartWARE Evaluation are displayed chronologically as standard in the batch overview.
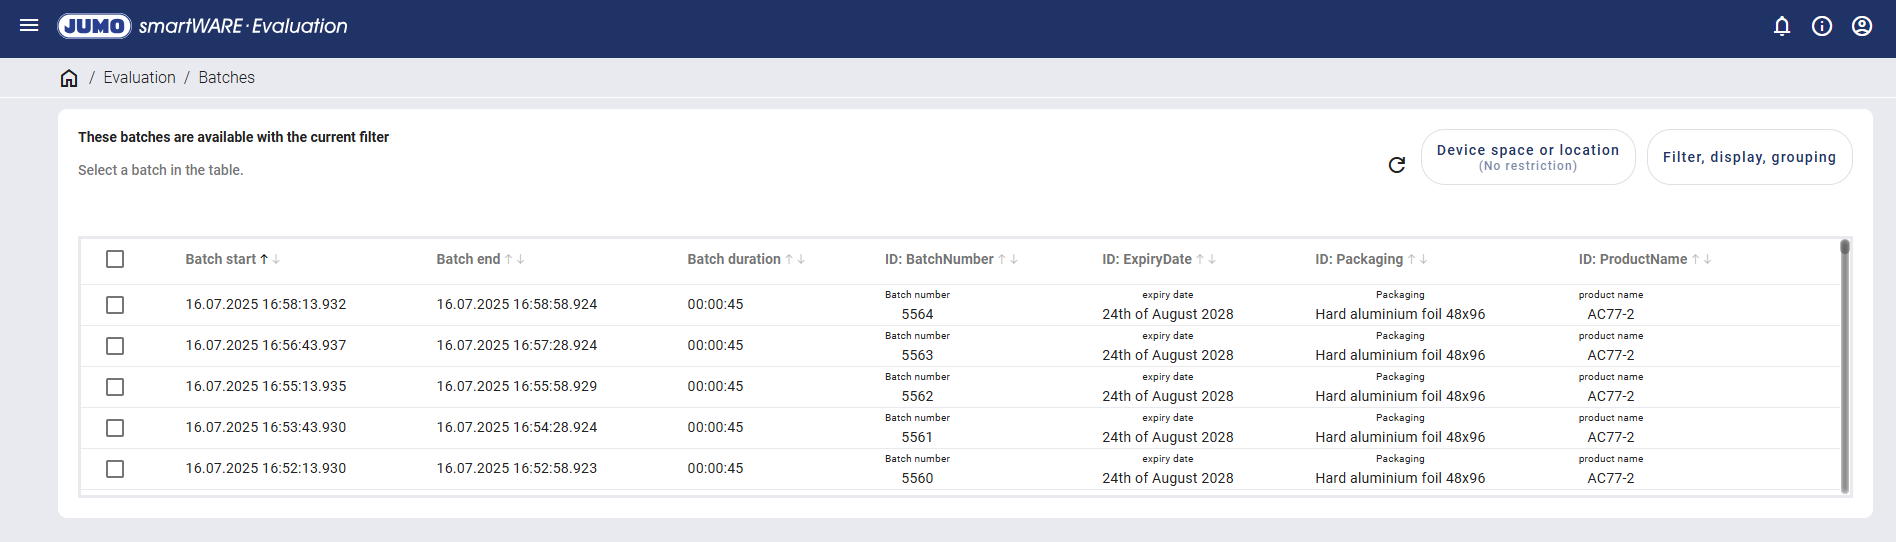
The table is limited to a maximum of 500 entries. If the desired batch is not included in the results, the filter must be modified accordingly.
The batches can be filtered by devices or locations using the "Device space or location" button. Furthermore, additional specific filter and display options are available using the "Filter, display, grouping" button.
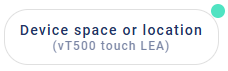
If a filter is active, it is indicated by a green circle on the relevant button.
Batch selection
Individual evaluation
The following icon appears on the right-hand side when hovering over a batch:
Icon | Function | Description |
|---|---|---|
Individual evaluation | The dashboard selection is opened. |
Joint evaluation
Multiple batches can be evaluated in one dashboard using the joint evaluation. To do so, the batches widget offers the function to switch between the relevant batches and optionally zooming into the relevant time range.
The boxes on the left-hand side can be used to select multiple batches at the same time. Alternatively, multiple selections can be made by left-clicking them while holding down the Shift or Ctrl key.
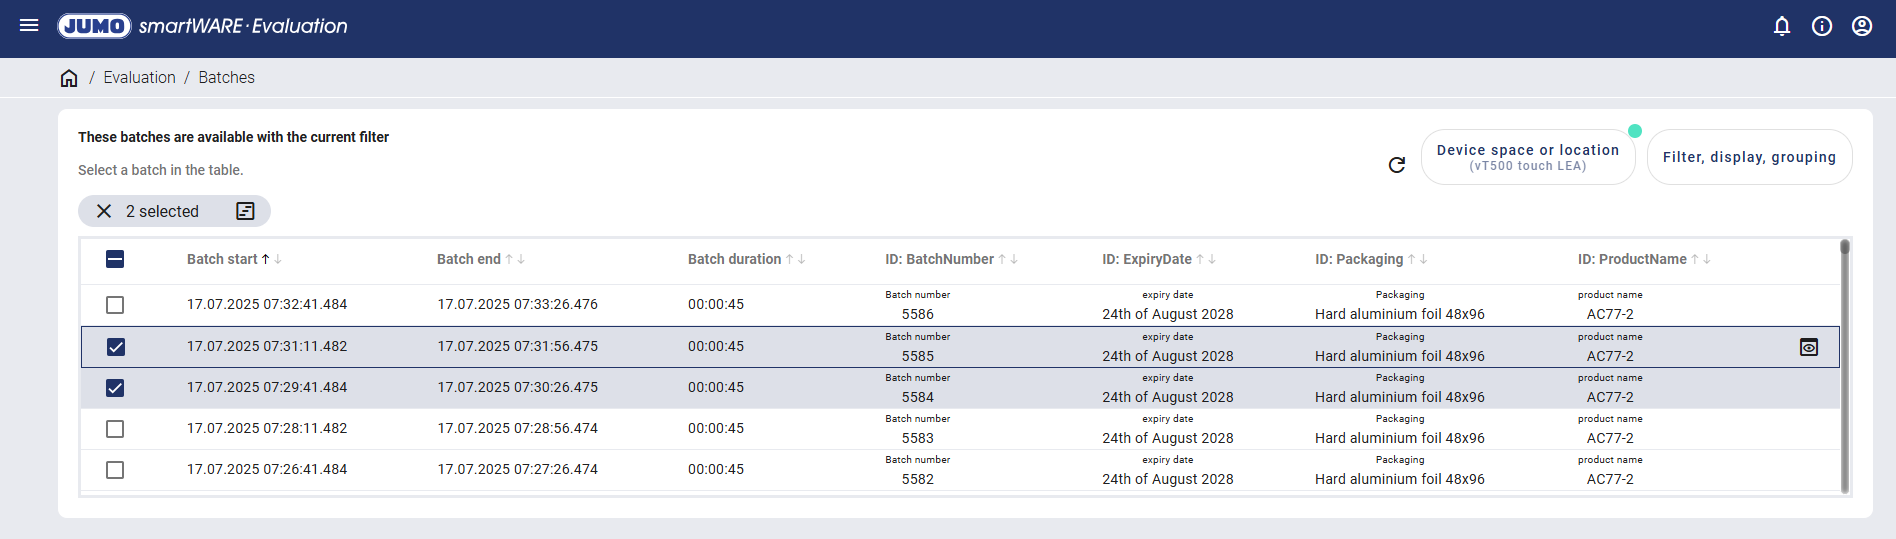
If multiple batches have been selected, a new menu with the following icon appears:
Icon | Function | Description |
|---|---|---|
 | Joint evaluation | The dashboard selection is opened. |
Dashboard selection
Following selection of the batch(es), a dashboard must be selected for the batch evaluation.
If a device is assigned to multiple dashboards in JUMO smartWARE Evaluation, they are listed.
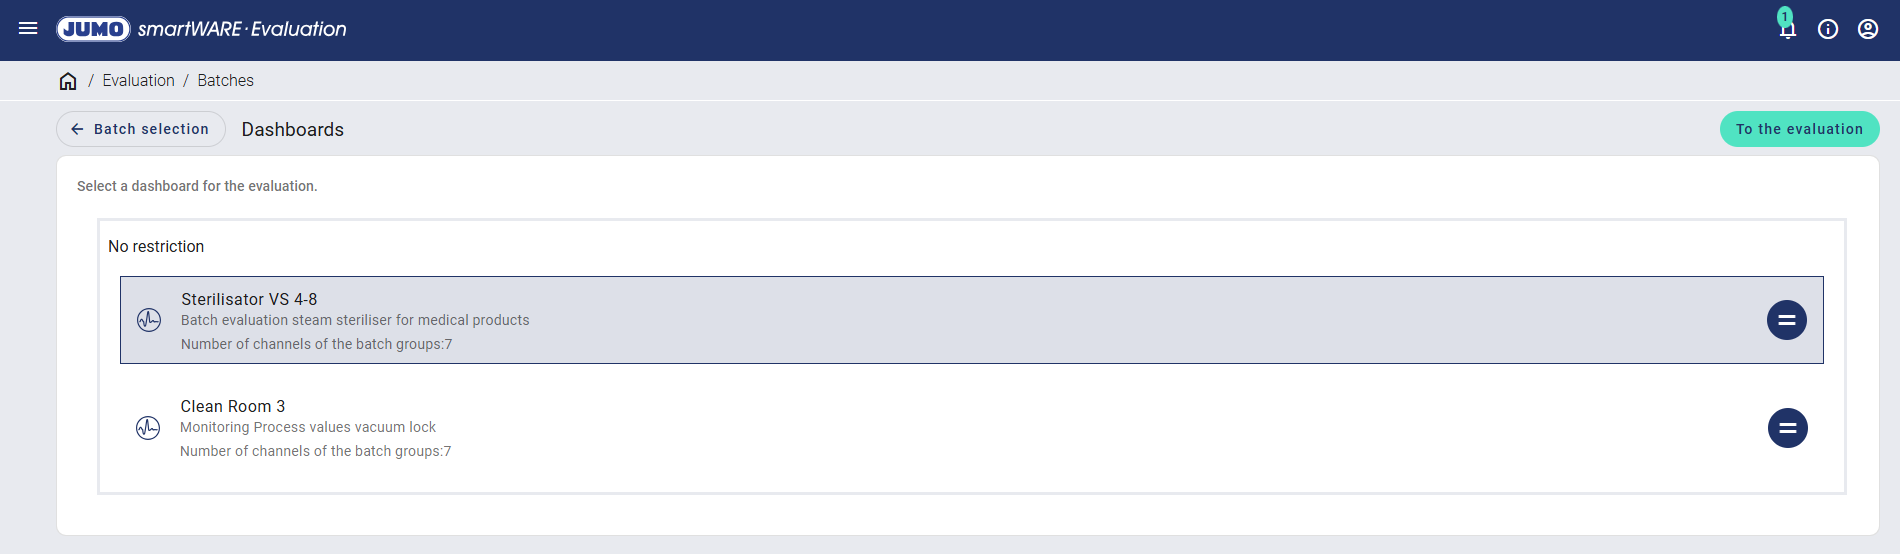
One of the following icons is displayed for each dashboard. These icons can be used to open the channel assignment, in which the channels of the selected dashboard are compared with the channels assigned to the batch.
Icon | Description |
|---|---|
 | The channels of the batch(es) and the channels of the dashboard match. |
 | The channels of the batch(es) and the channels of the dashboard do not match. The groups and channels can be modified in the dashboard configuration. |
After selecting the dashboard, the dashboard is opened using the "To the evaluation" button and the batch can be evaluated.
Channel assignment
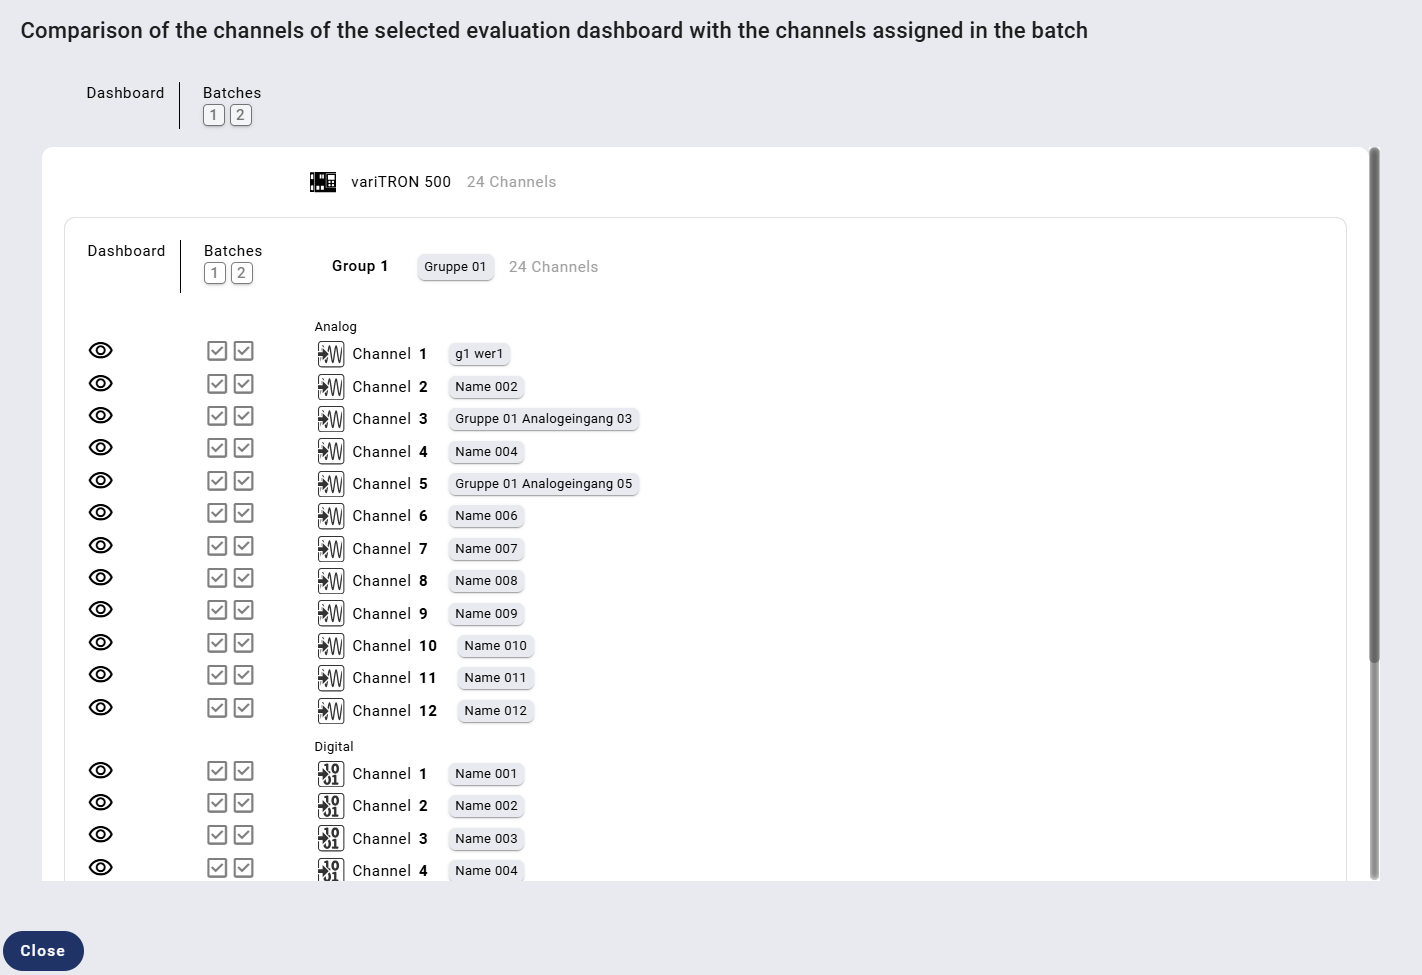
The name of the batch(es) and the number of associated channels are displayed in the upper area. The channels are divided according to whether they are analog or digital and are listed accordingly.
If a channel is also present in the selected dashboard, an eye icon is displayed; otherwise, a dash appears.
In the case of joint evaluation of multiple batches, it may be that no suitable dashboard is found. In this case, a message appears and the figures for the relevant batches are marked in red. Either another dashboard or another batch then has to be selected or the existing dashboard modified.
To return to the dashboard selection, exit the window using the "Close" button.
Filter, display, grouping
Settings can be made for the evaluation of batches.
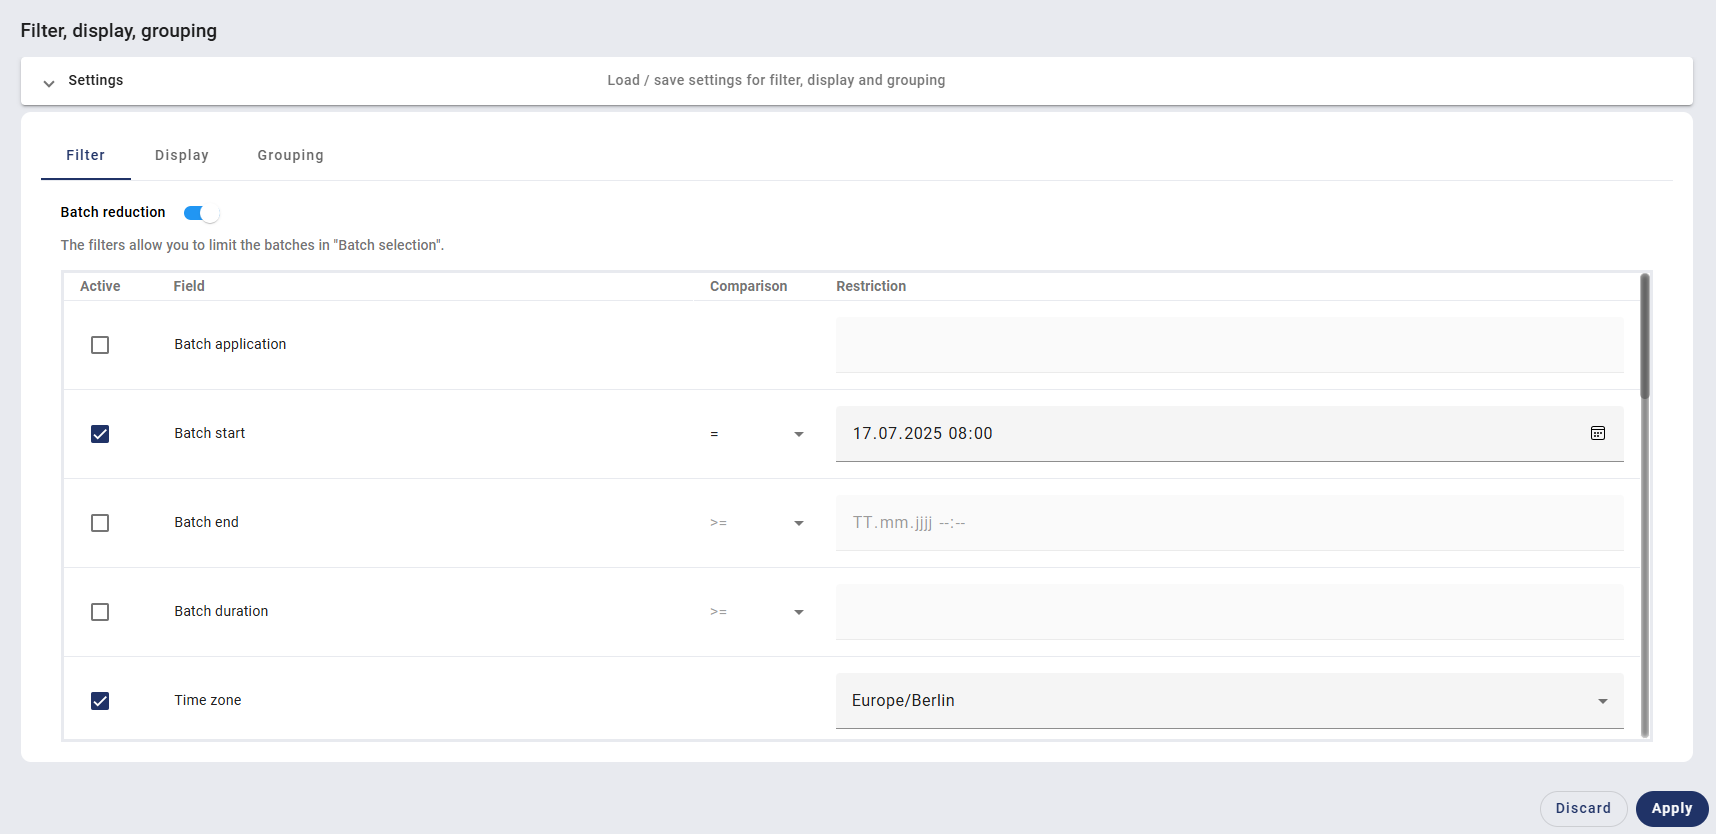
Filter
The batch selection can be limited using the filter.
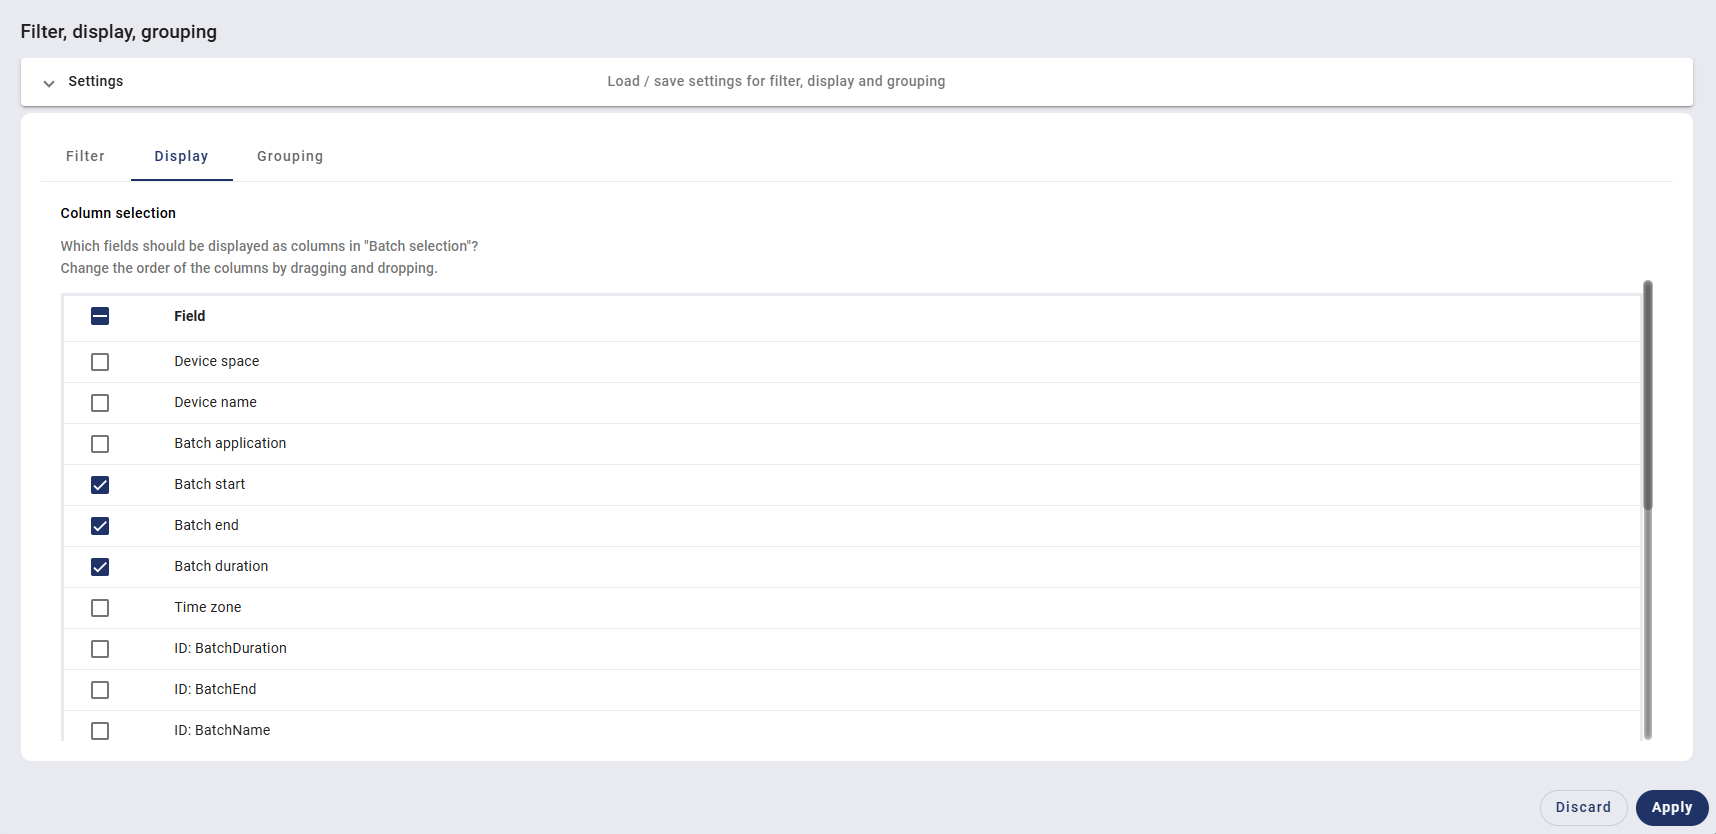
Display
The display defines which fields and batch lines are to be displayed in the batch overview. The order can be modified using drag and drop.
Grouping
Multiple batches are amalgamated into a joint evaluation.
Using the grouping function, the user can filter according to a particular ID.
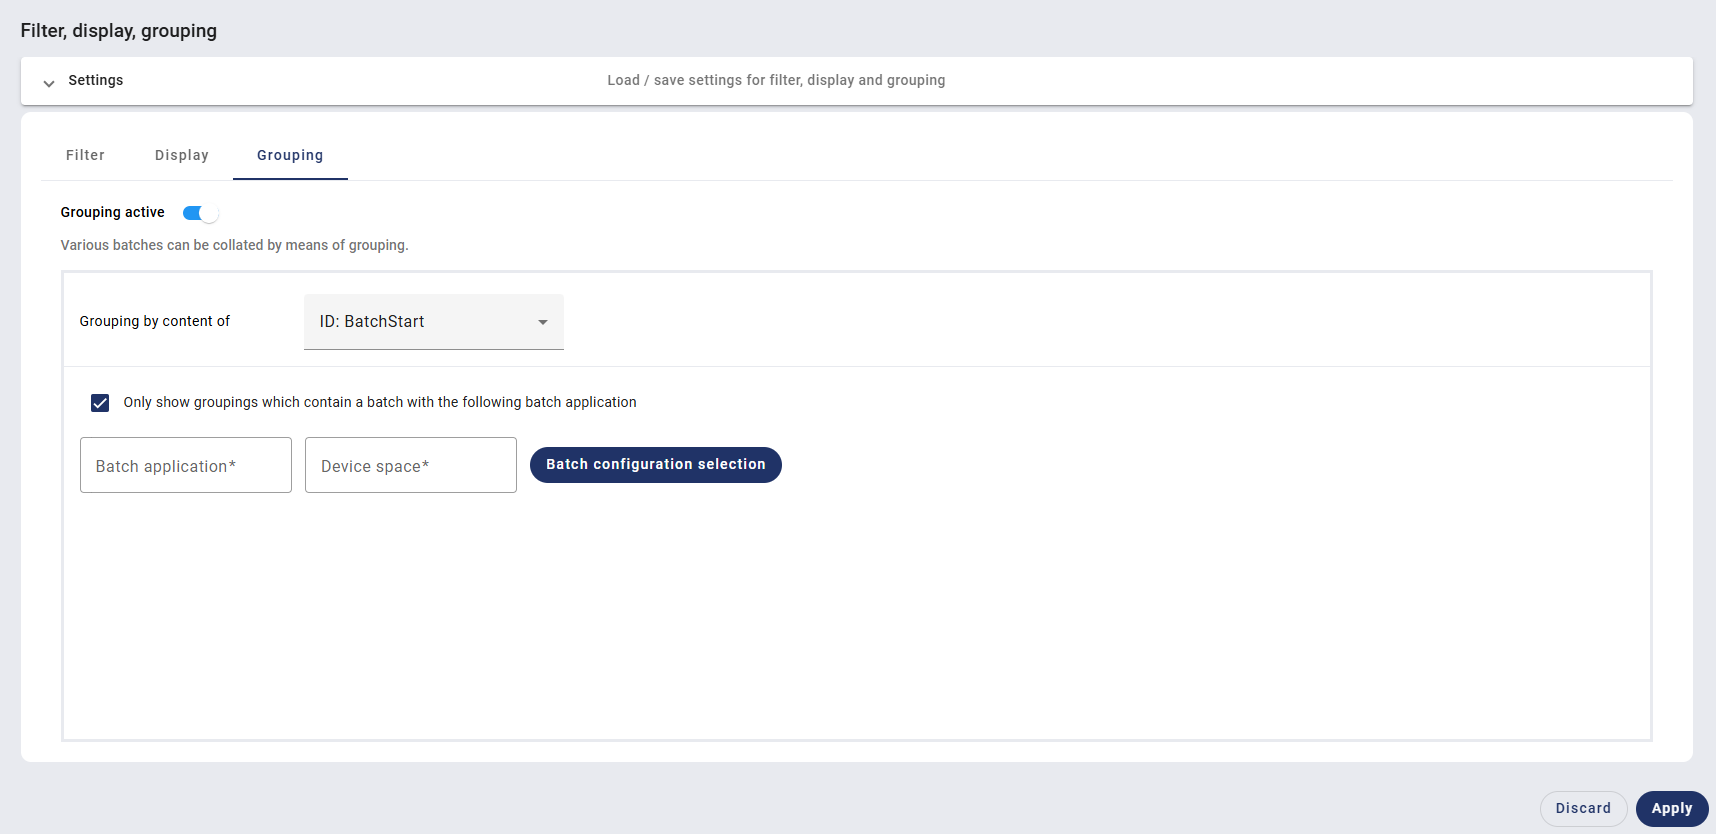
If, for example, various batch applications are present in the system and only those batches with a TagNo can be displayed, this can be carried out using the grouping.
Settings
The settings in the "Filter, display, grouping" area can be saved. Settings that have already been saved can be loaded or deleted.
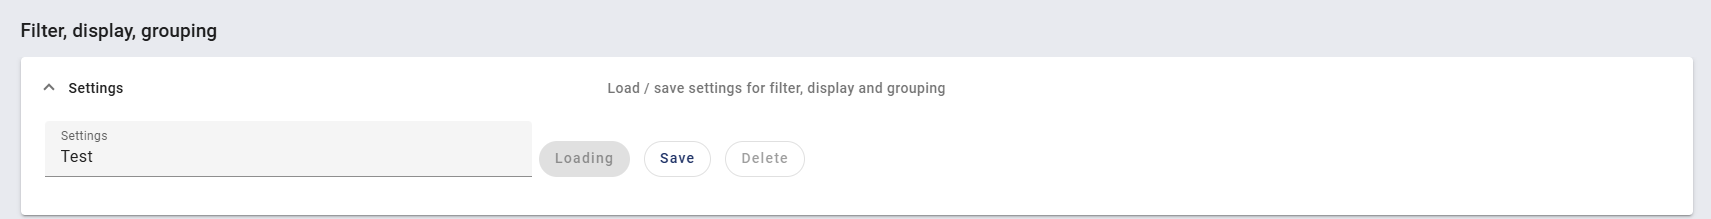
The settings are collapsed as standard and first have to be expanded.
The designation for the settings has to be entered in the text field. Settings that have been made can then be loaded, saved, or deleted using the relevant buttons.