Widget: Mixed Signal List
Use
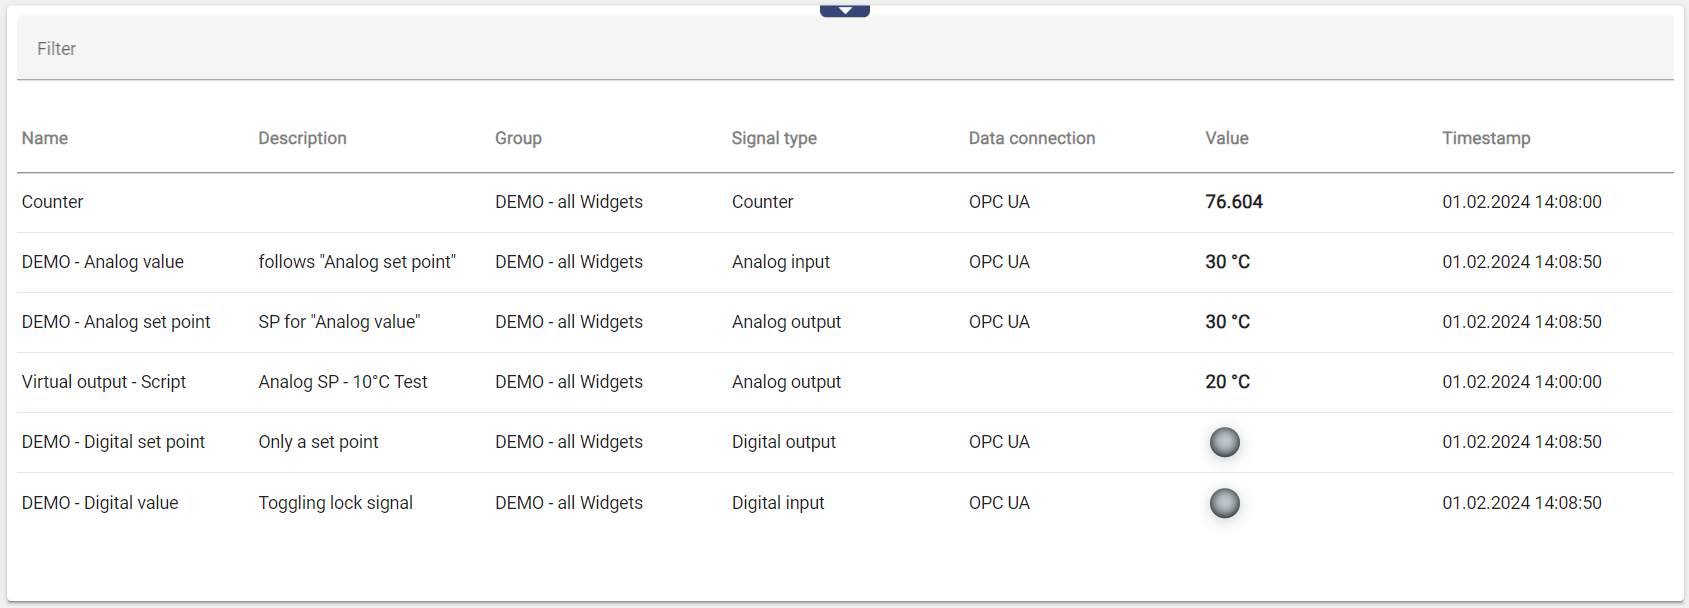
The Signal List widget presents the analog and digital signals you selected, including timestamps and other configurable information, in a tabular view.
Configuration
First of all, select the Signal List widget from the Signals category.

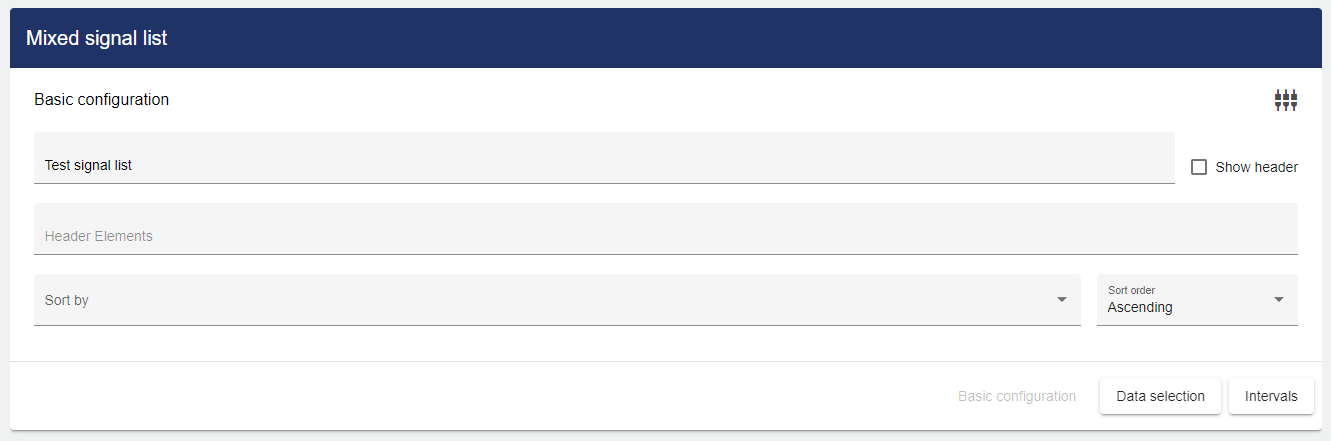
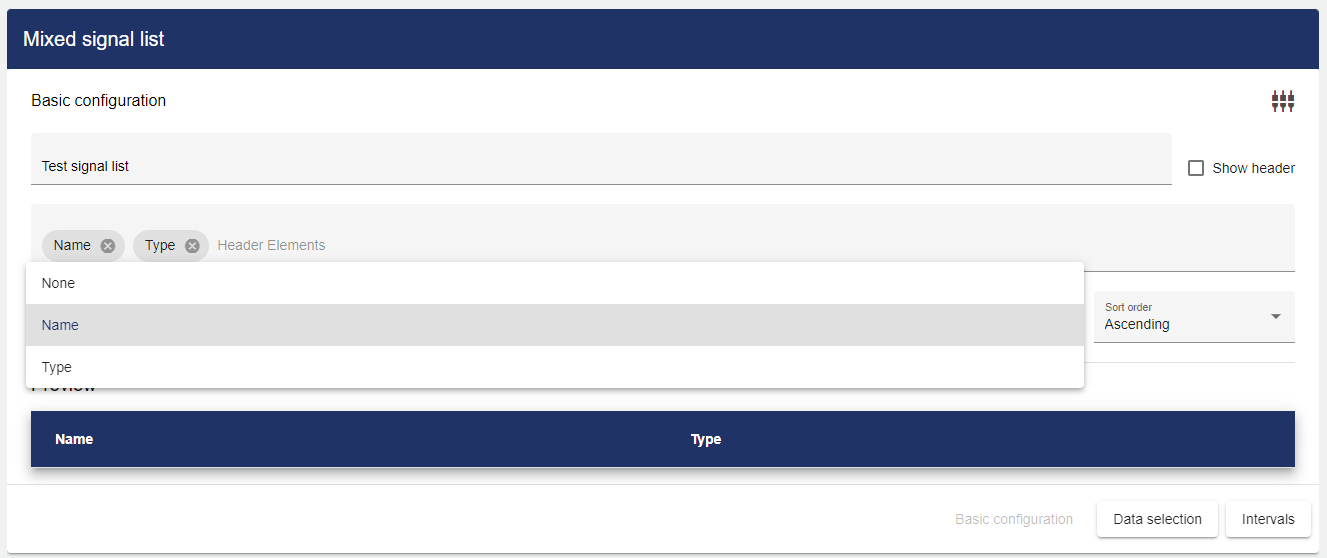
In the Basic Configuration of the Signal List, assign a suitable label (title). The header can be displayed by selecting the check box.
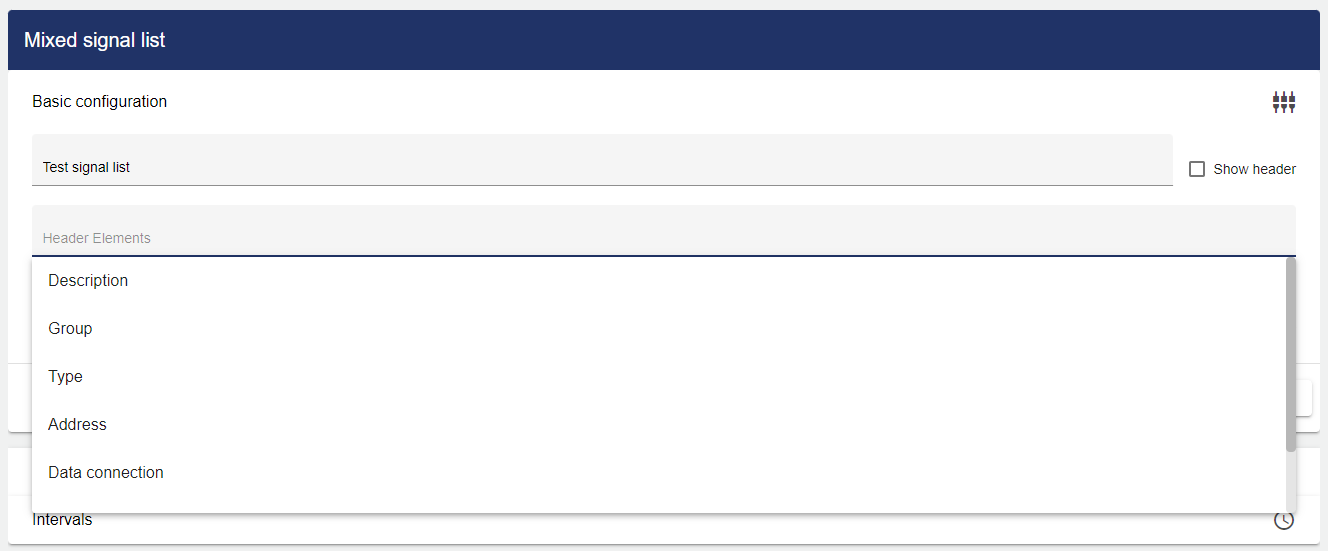
Then you need to use the drop-down menu to select the individual parameters (called "header elements" here) that you want to be included in the list. The following two options are available for this:
You can then use the "Sort by" drop-down menu to select the order in which you want the selected signals to be sorted.
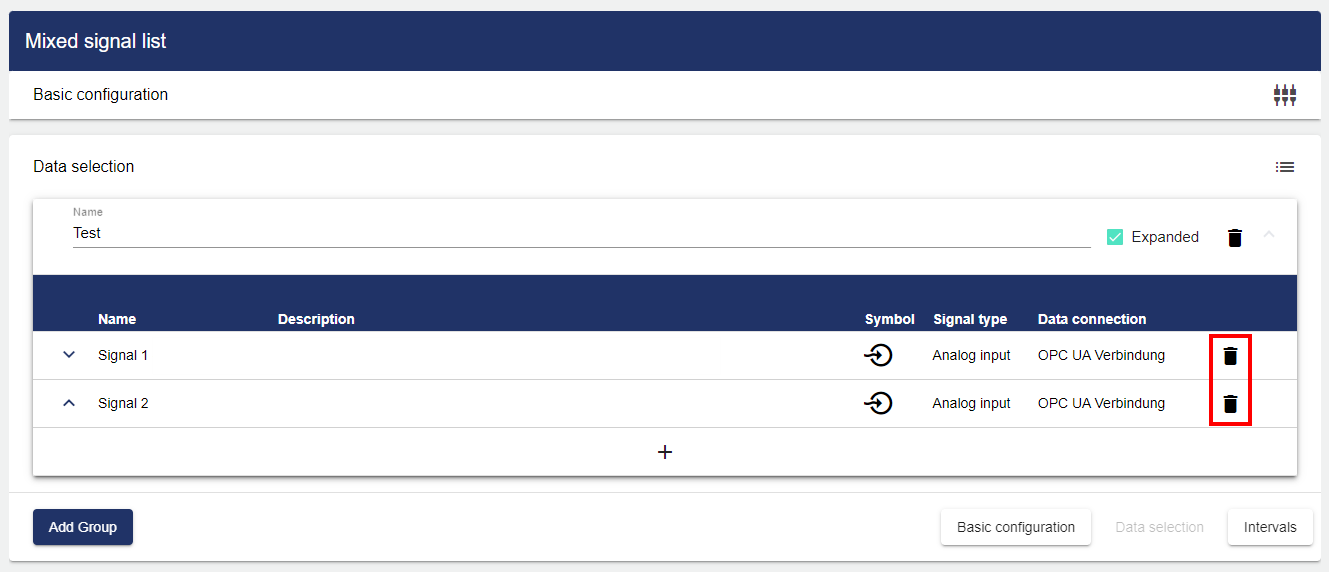
In the Data selection, you can add one or more group(s) via "Add group". You can use the arrows to change the order of the groups. These are then sorted according to the previously created order. The name is user-defined. The "Expanded" field is used to specify that the group is always fully visible or is displayed in a reduced form. Click the line or the arrow icon on the right to manually expand or collapse the group.

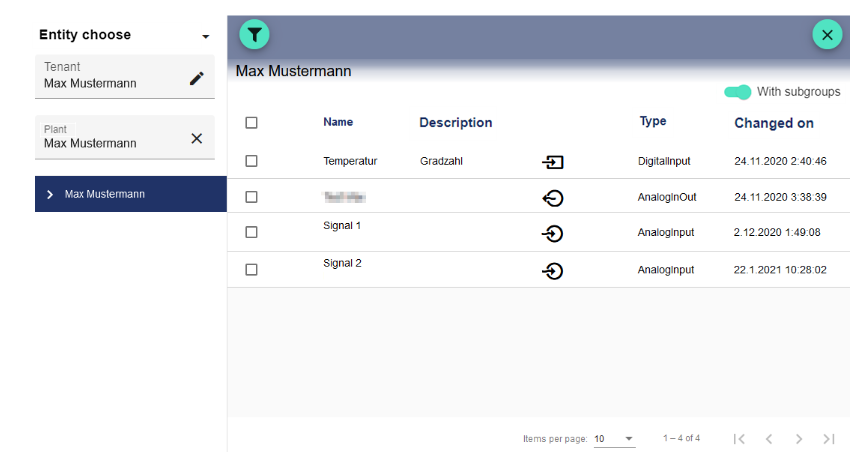
Clicking the Plus button opens the Select Entity window. You can add a previously created signal here.

The checkboxes can be used to mark multiple signals and select them all simultaneously.
Signals can be removed via the trash can icon.
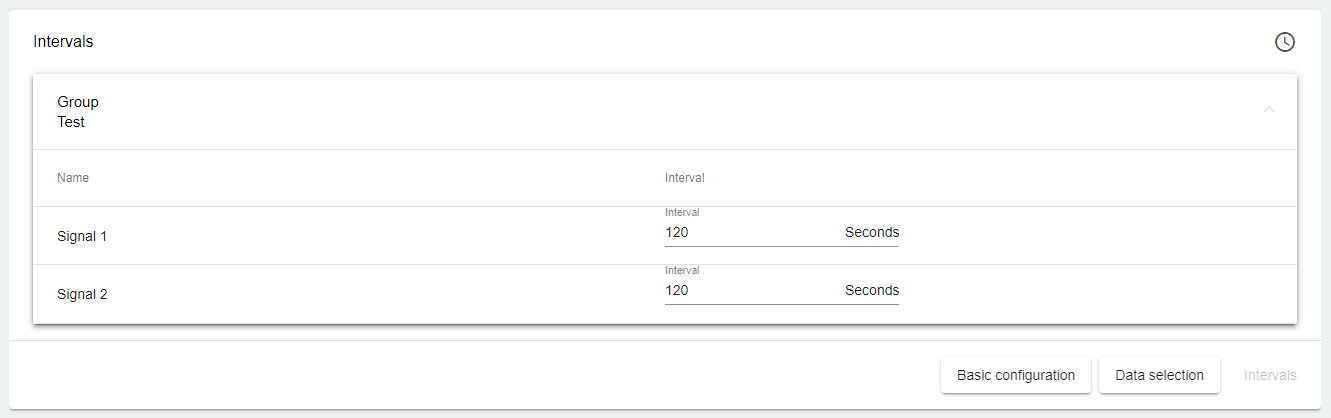
In the "Intervals" field, you can add an interval to the signals within the groups from which the signals are retrieved. Click the line to open the setting. If the signal is not updated within the specified time, it is marked in red in the Dashboard. The actual sampling rate of a signal is described in the following chapter: Signal.