
Widget: Liquid Fill Gauge
Use
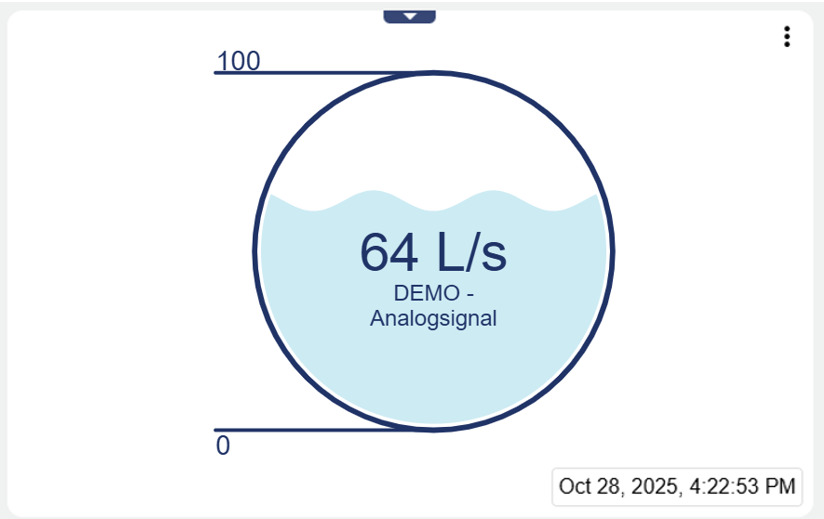
The widget displays the data of the selected analog signal as a wave. The fill level changes depending on the value and the set limits. When configuring the fill level measuring instrument, you have many options and a preview to visualize the changes in real time.
The three dots in the upper right corner ![]() can be used to call up the following detailed information about the signal:
can be used to call up the following detailed information about the signal:
 | Can be set via "Manage conditions" (see below). Allows to edit the conditions (Alarm thresholds) set in the signal. |
|---|---|
 | Can be set via "Include signal history" (see below). Allows you to view in list form when which historical values were stored in the system. |
 | Can be set via "Include signal history" (see below). Allows you to view the historical values of the signal via chart . |
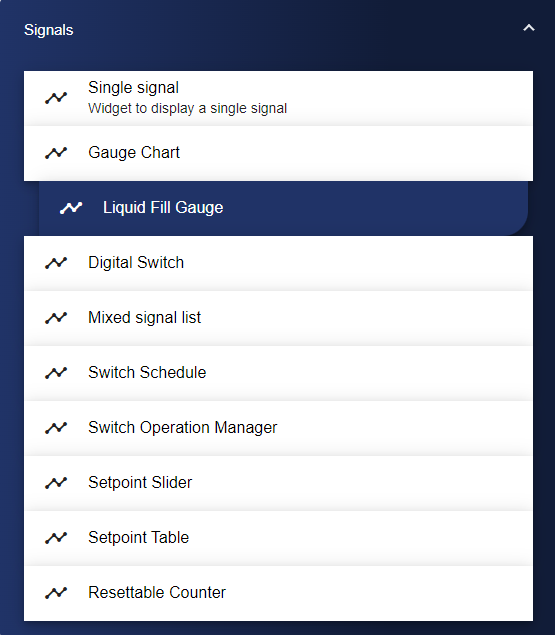
Configuration
Select the Level Measuring Instrument widget from the Signals category.
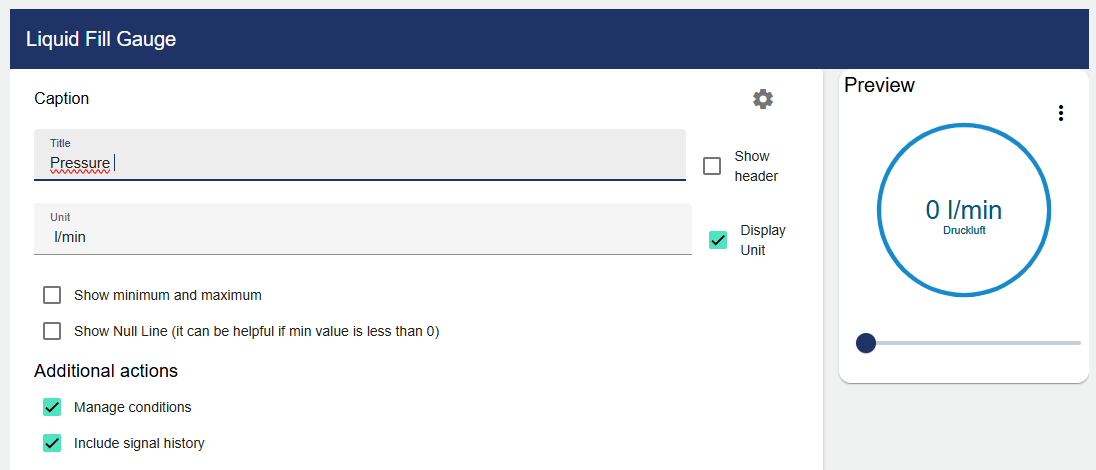
In the Basic Configuration of the Level Measuring Instrument, assign a suitable label (title). The header can be displayed by selecting the check box. You can add a unit or suffix to the displayed value, which is shown after the value. If necessary, the width of the outer and inner circles can be adjusted.
As described above, you can also set whether the conditions and signal history should be displayed. You can also set whether the min, max, or zero line should be displayed or not.
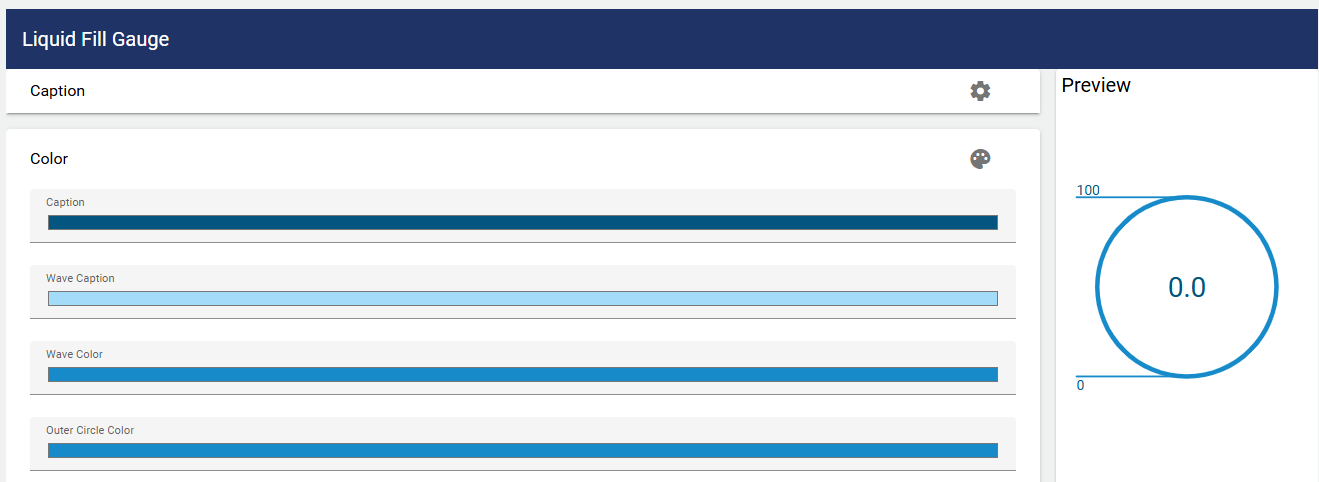
To customize the colors, click the "Color" tab. The marking color is for the marking that is not covered by the wave. The wave marking is for the marking that is covered by the wave. You can also customize the wave color and the outer circle color.
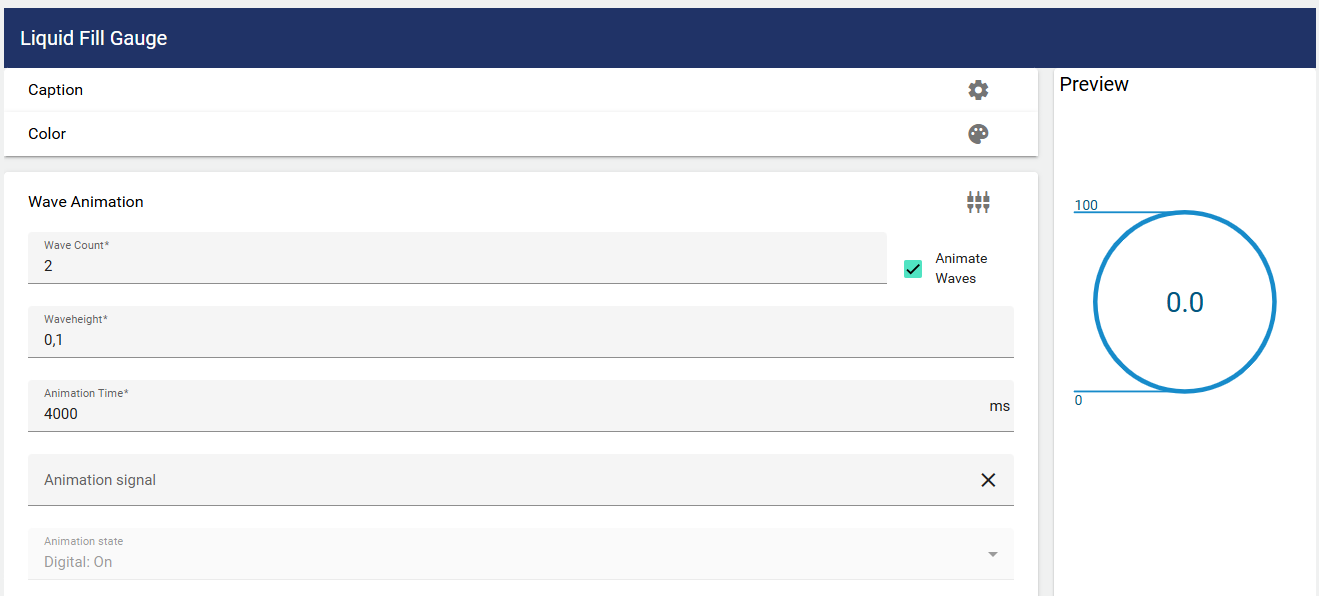
To display multiple waves in an animation, go to the "Wave Animation" tab and set the Wave Count value to the number of waves you want to display in the animation. The animation time of a wave can also be adjusted.
The wave animation can be switched on and off via a digital signal. Use case example: If there are waves in a water application, this is visible in the widget.
Now you need to include a signal. To do this, click "Select Signal".
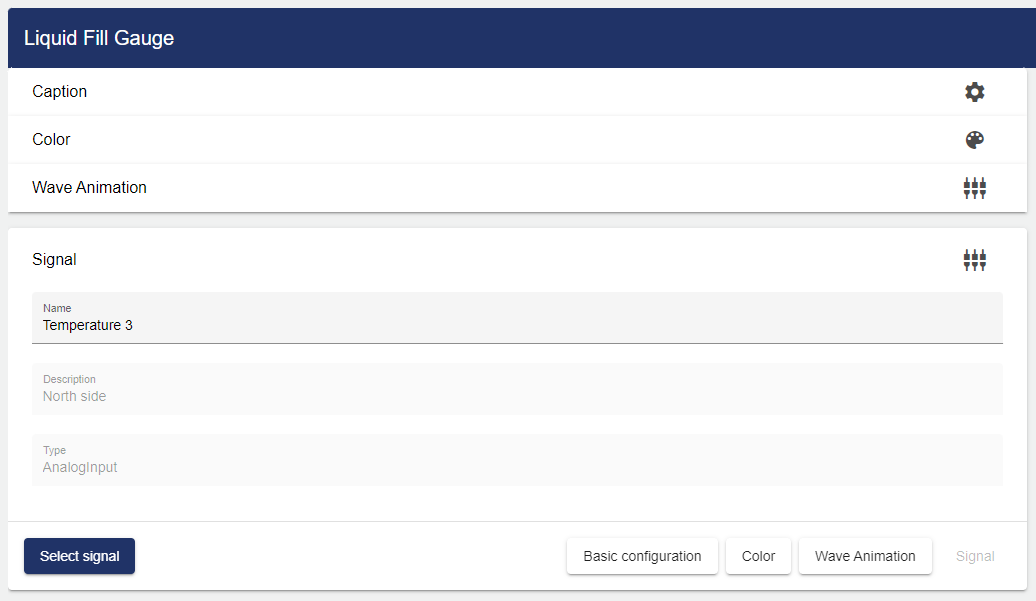
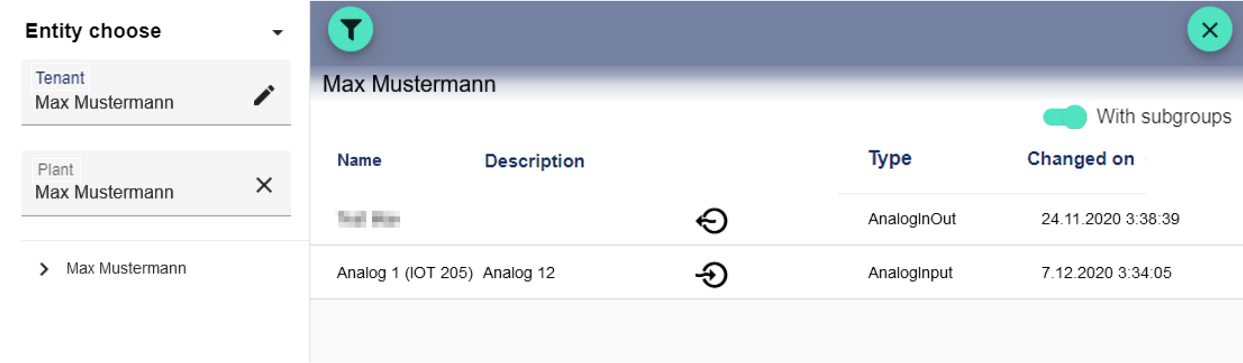
Clicking "Select Signal" opens the Select Entity window. You can add a previously created signal here.
Once you are satisfied with your configuration, you can save it.