
Widget: Basic Map
Use
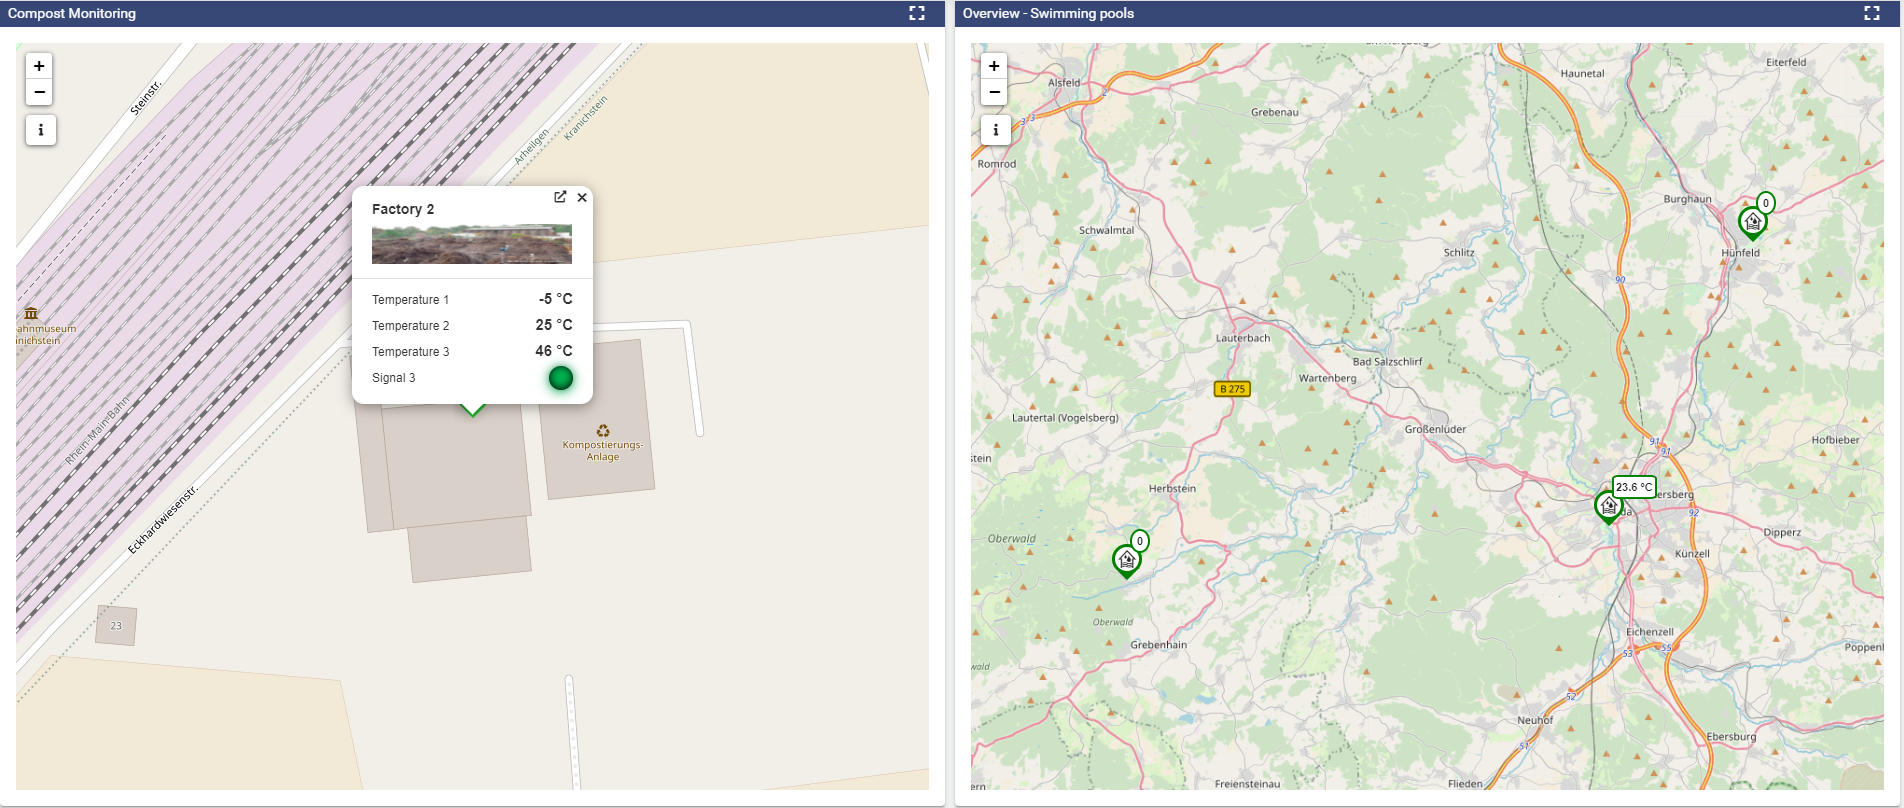
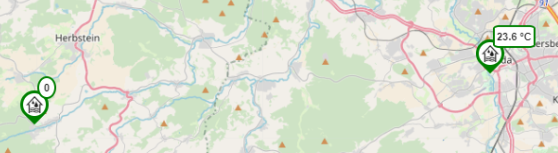
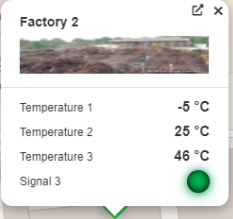
The Map allows you to visualize an open-street map with different markers and icons. In this way, you can display your objects/systems in an optimal way and always see at a glance whether there is a fault (unacknowledged event) or similar at the landmark you have selected. This can help by notifying employees to resolve issues quickly and efficiently. If you click one of your markers, you receive additional information and the option to "jump" to a corresponding Dashboard. To do this, click the arrow that points out of the box.
Configuration
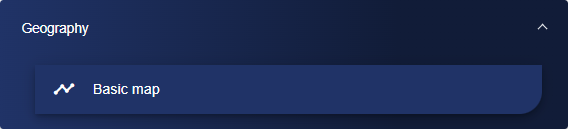
Select the Map widget from the "Geography" category.
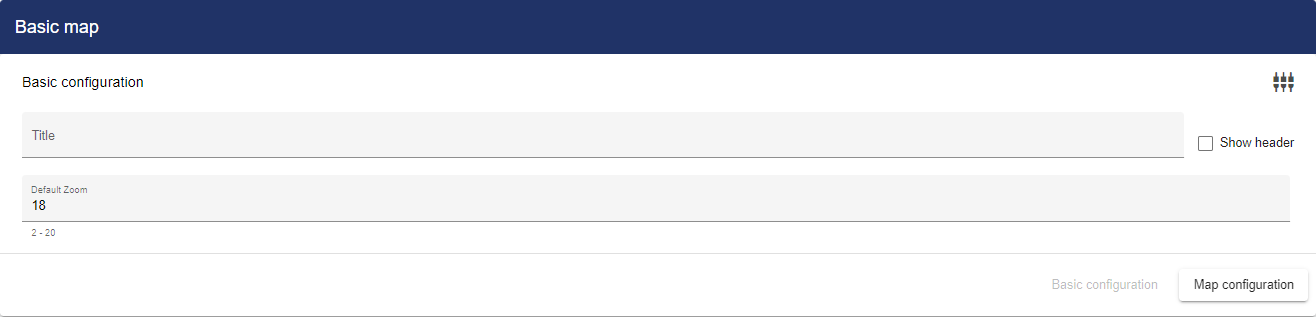
Assign a suitable title in the Basic Configuration for the map. The header can be displayed by selecting the check box. The default zoom specifies the zoom factor (2 - 20), in which the map is displayed after the widget is started. The smaller the factor, the further out the zoom. The zoom can be varied using the mouse wheel.
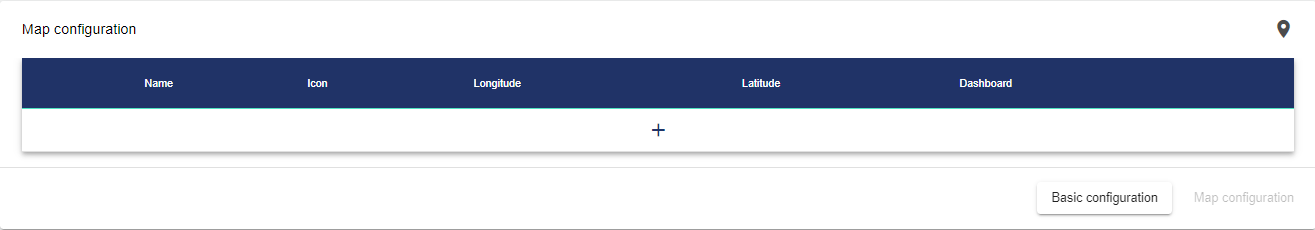
Then go to the "Card Configuration" tab and click the "+" icon. A drop-down menu opens in which you can choose between Group, User-defined and Dynamic:
Group | This setting uses the location (longitude, latitude), the group image and the description of the respective group. These can be configured under Details. |
|---|---|
User-defined | With this setting, the length and width specifications can be set individually in the widget. |
Dynamic | With this setting, the length and width data can each be integrated from a Signal. The corresponding signal can be transmitted dynamically from a GPS source to the JUMO Cloud via the JUMO variTRON using a gateway and SIM card. This mode allows moving objects to be mapped in the widget. |
Position monitoring | With these settings, the position monitoring can be made visible in the widget. If an object approaches the monitored GPS area, this is indicated as follows:
|
Images can only be included as described when "Group" is selected.
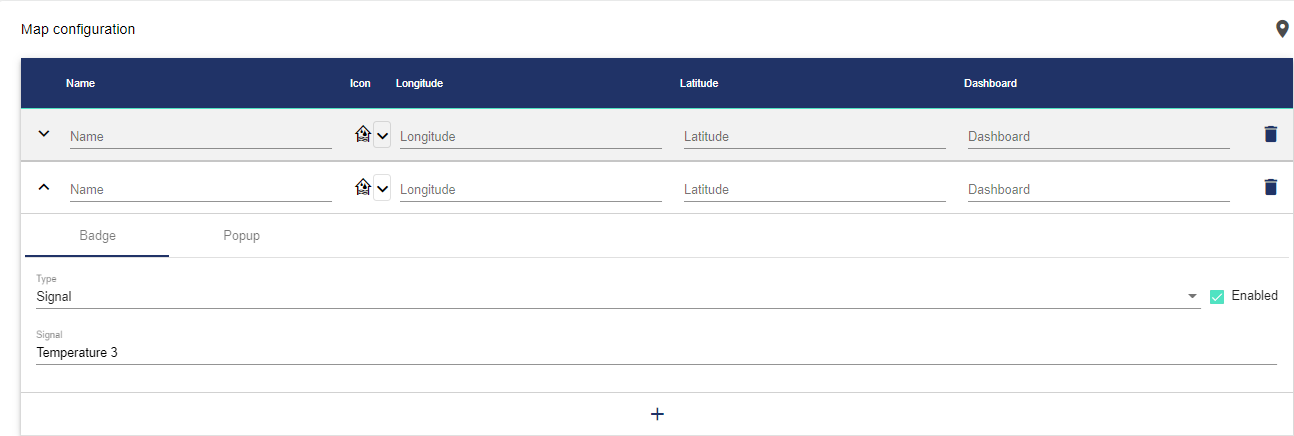
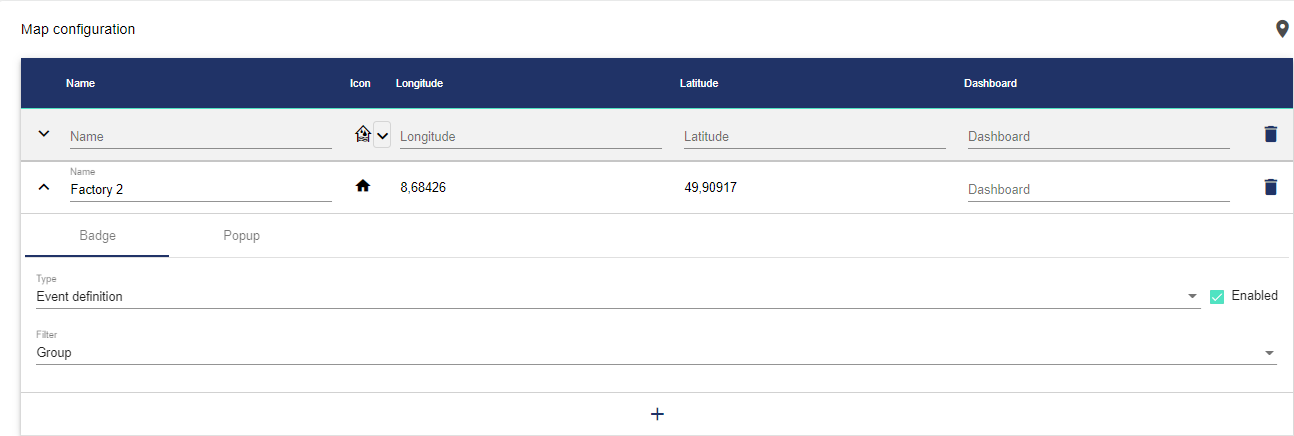
The "Badge" is used to set what can be seen on the landmarker. Signals as well as an Event Definition and an Event Category can be selected here. For a signal, the value is displayed in the bubble above the marker (on the right in the image below); for events, the respective number of active events is displayed (on the left in the image below).
You can add signals and choose an individual Recording Interval under the "Popup" tab. If the marker was created as a "Group", you can additionally specify whether the "Image" and the "Description" are also to be displayed.
Once you are satisfied with your configuration, you can save it.