
4.14 Update from
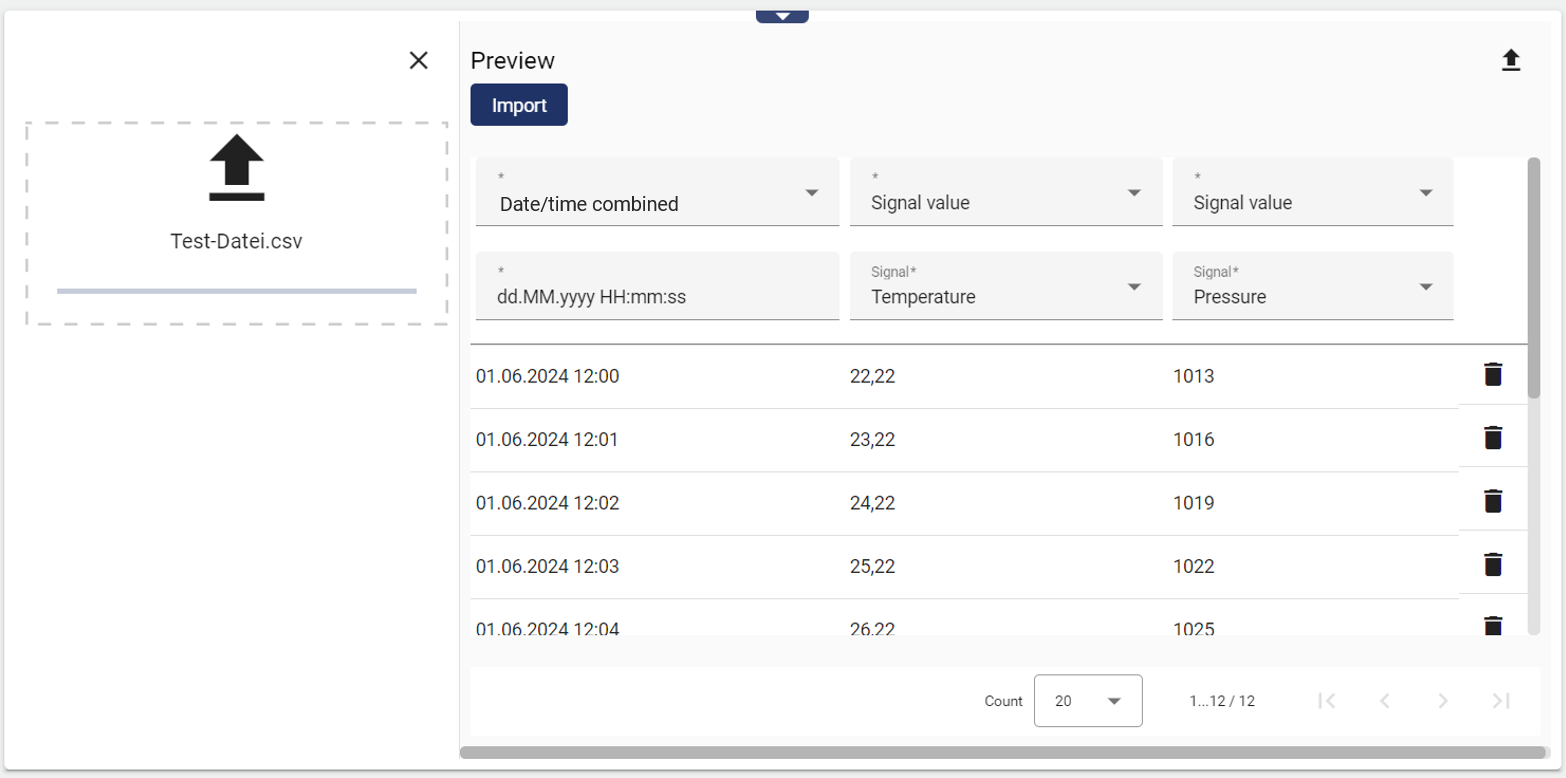
1.) The new Widget: Data import is now available, making it possible to import historical data into the system quickly and easily. All you need is a CSV file. The columns and formats can be changed in the widget as required.
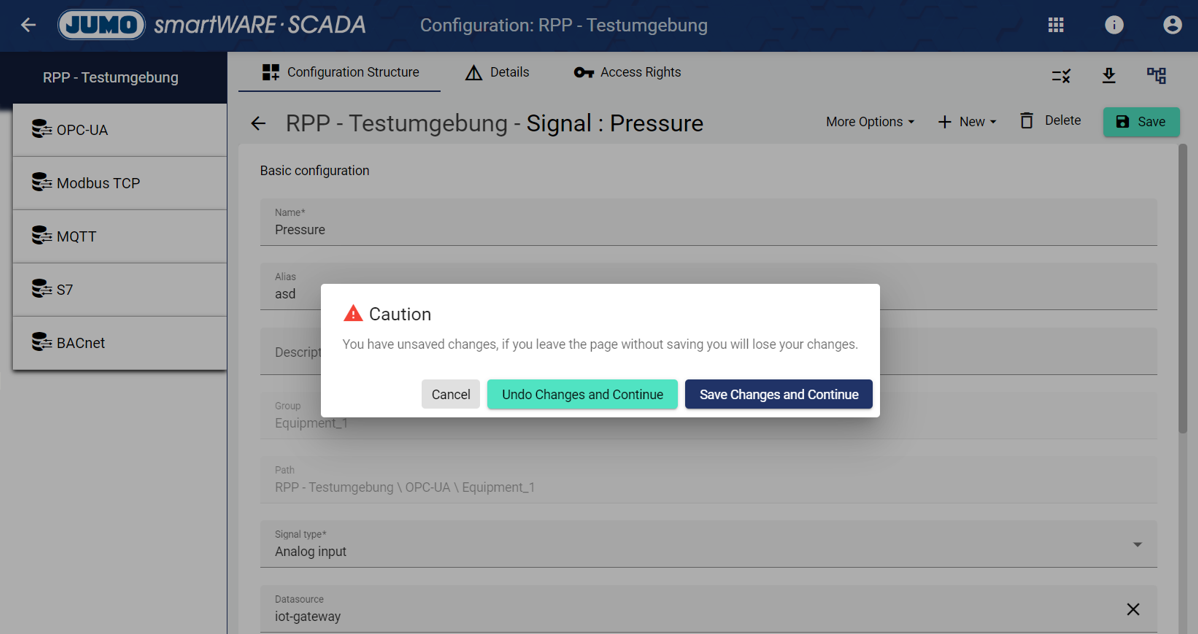
2.) In the new version, a message appears when leaving a dashboard or configuration page if there are unsaved changes. This reminds the user that the changes have not yet been saved. Previously, unsaved changes were deleted when leaving the page.
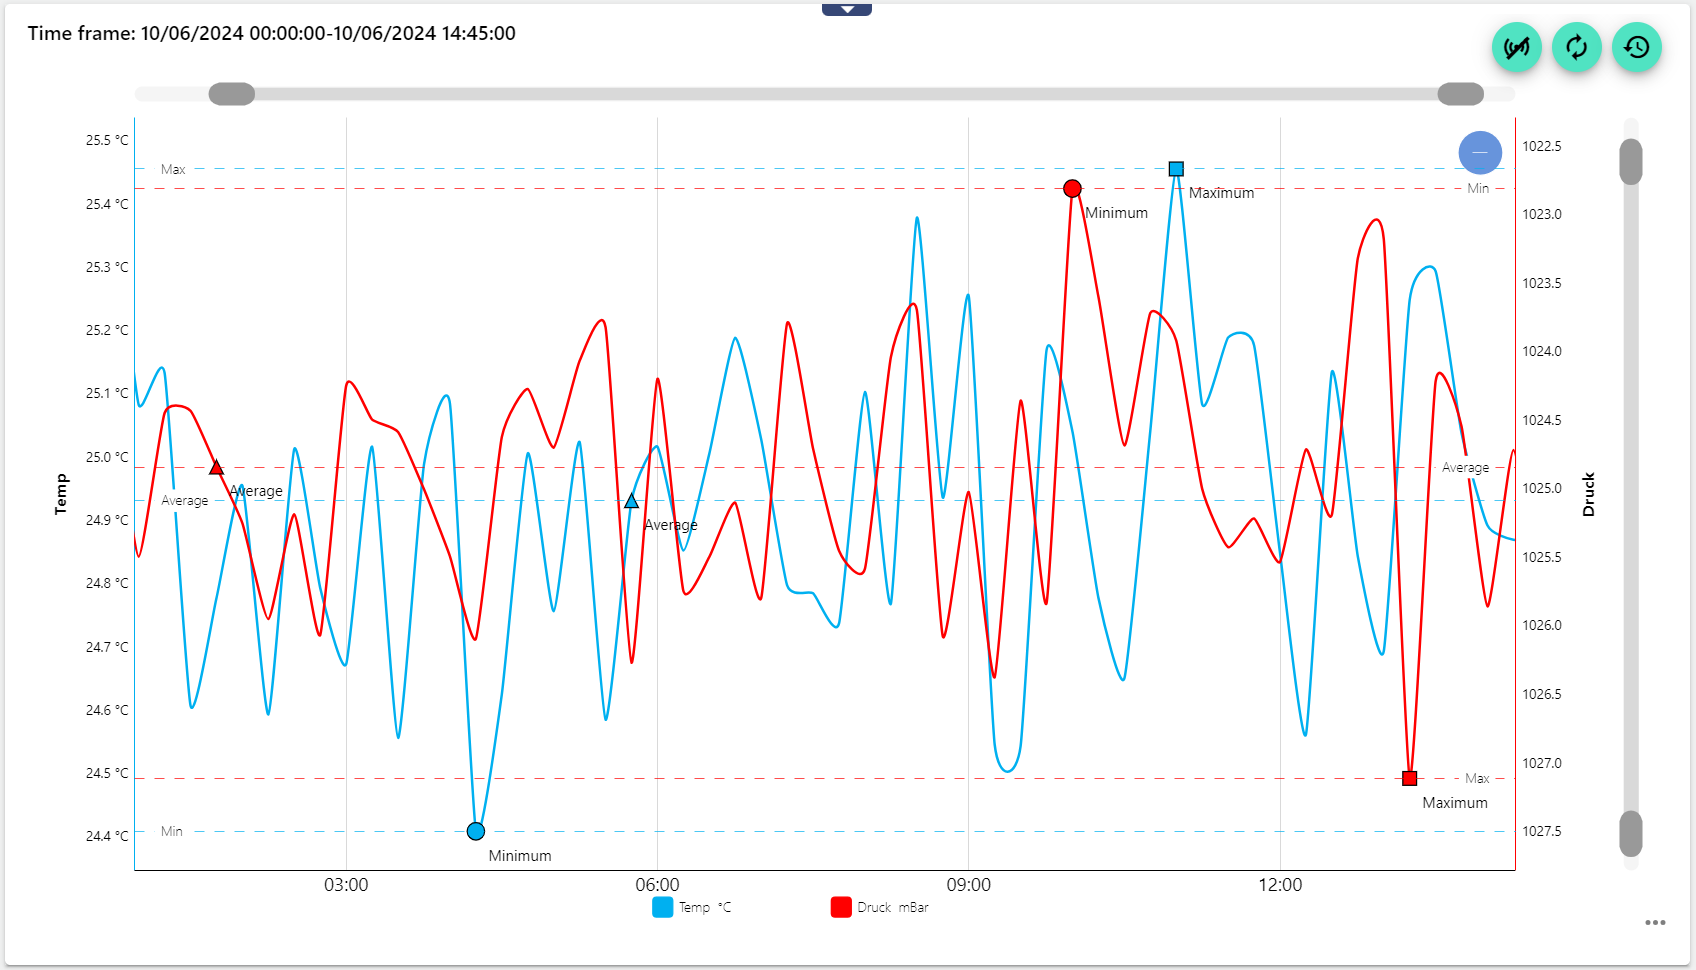
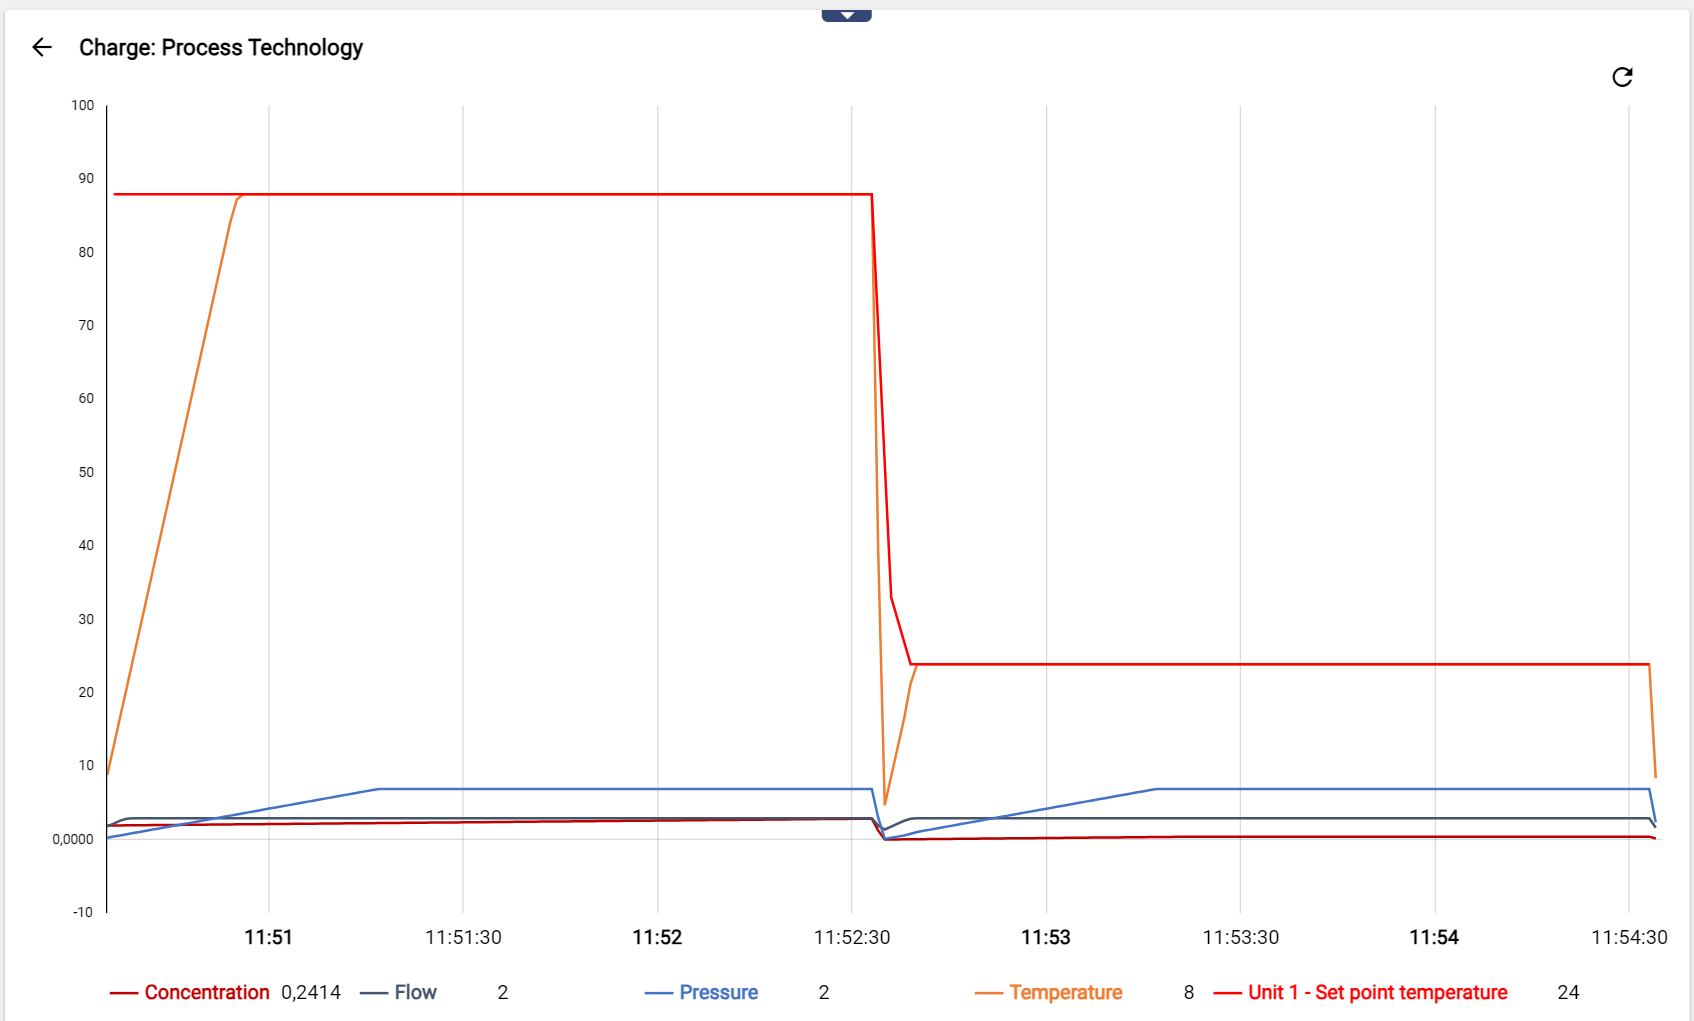
3.) Several new functions have been added to the Widget: XY-Chart, making it much easier to analyze Historical Data:
-
y-axis zoom enables zoom over the vertical axis (can be activated as an option)
-
Minimum, maximum and average values are displayed for each signal (can be activated as an option)
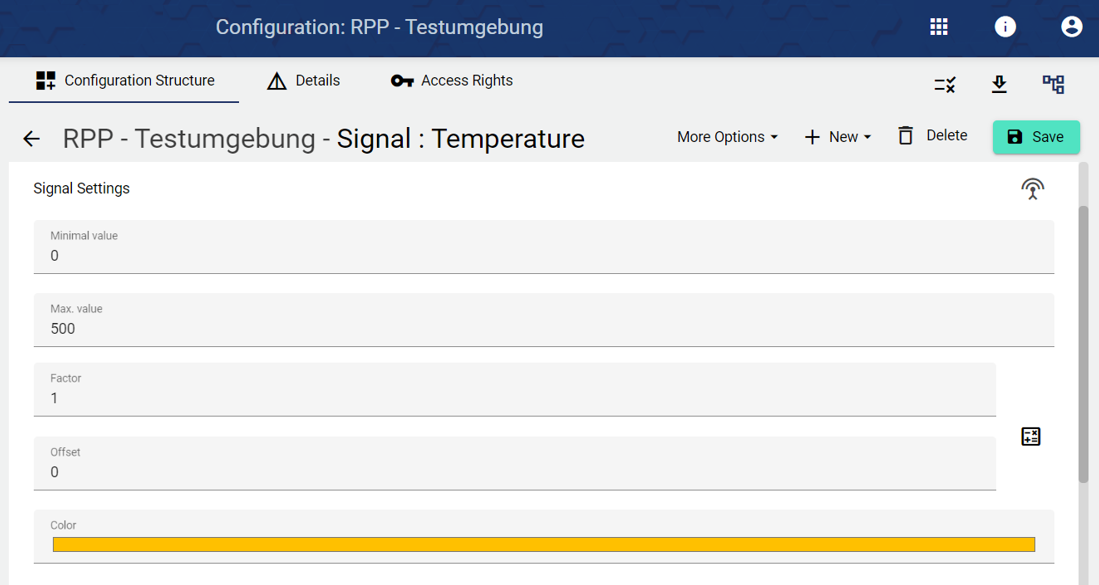
4.) From now on, the color defined in the configuration for an analogue or counter signal will also be used in the batch view, in the report and in the historical data view. This function increases recognizability and reduces project planning time.
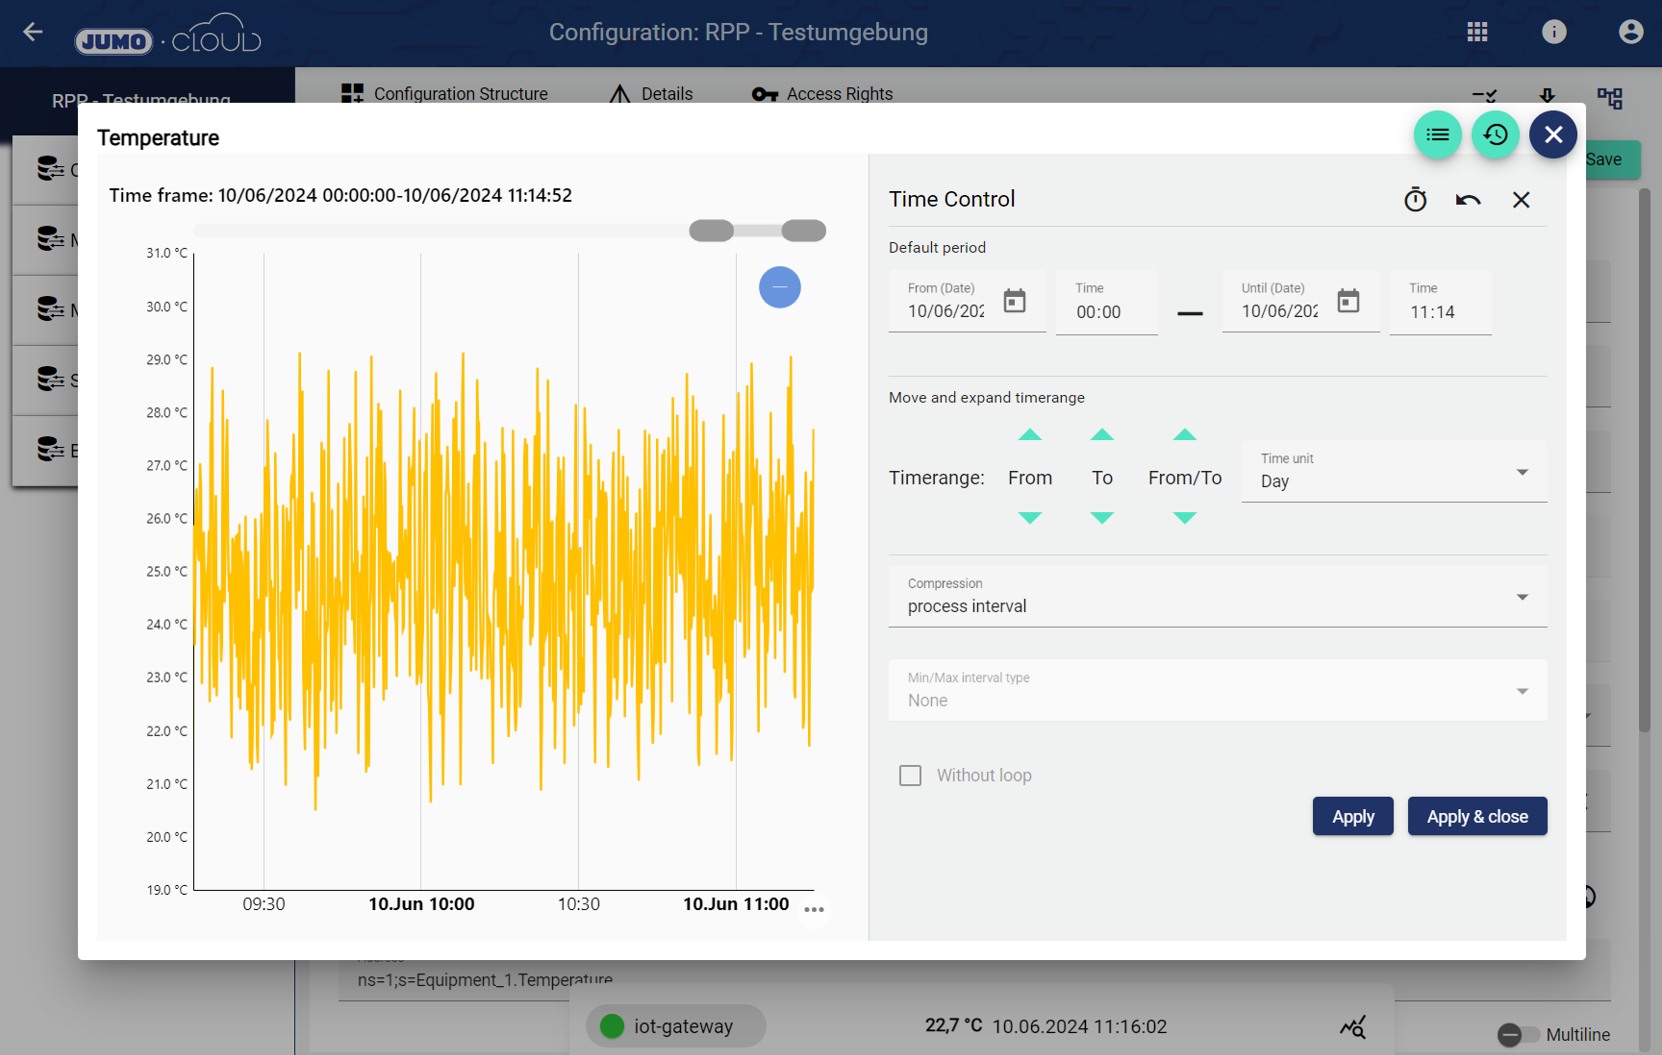
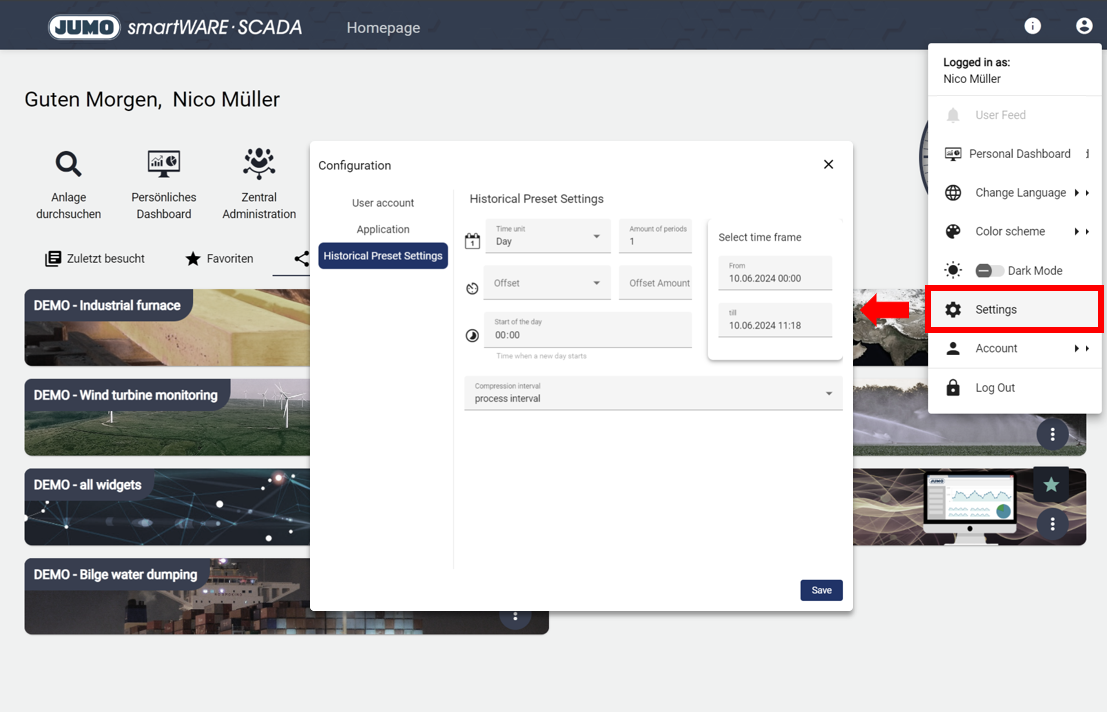
5.) The view of historical data has been optimized. It is now much easier and quicker to select a desired time range. User-specific preferences can also be preset. This makes it possible, for example, to always look at the last week instead of the current day when opening each historical data view.
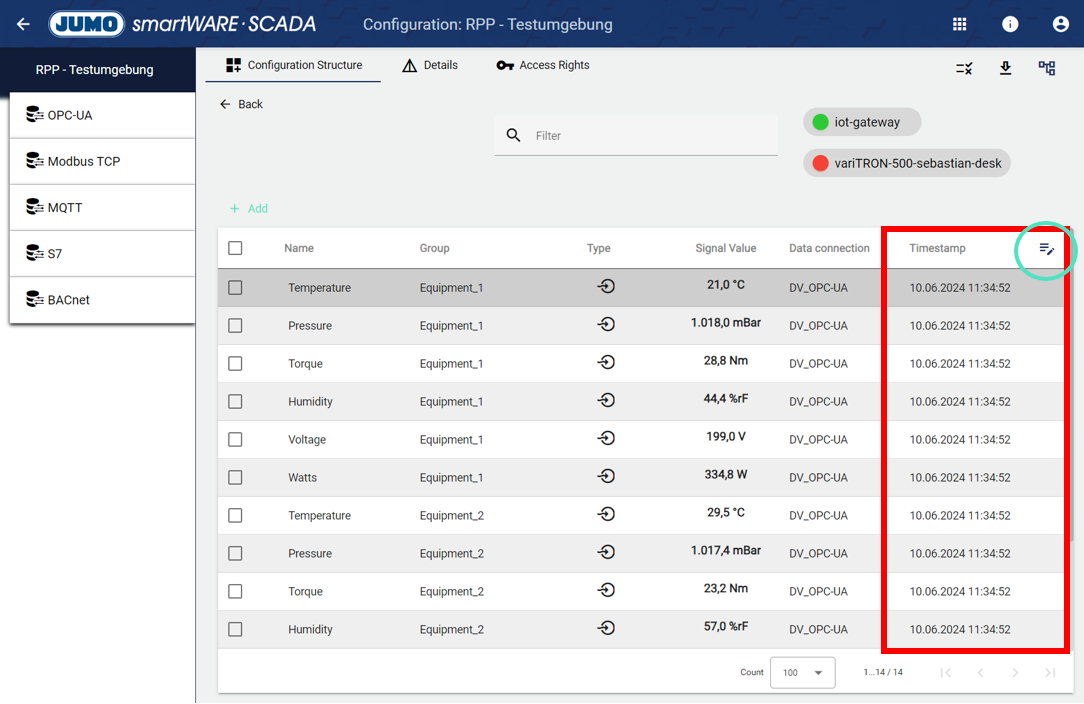
6.) The "Timestamp" column can now be displayed in the signal configuration. It is no longer necessary to hover over the respective signal value. Checking all available signals with the corresponding time value is now much easier and faster than before.
Like all columns, this setting is optional. It can be activated if required.
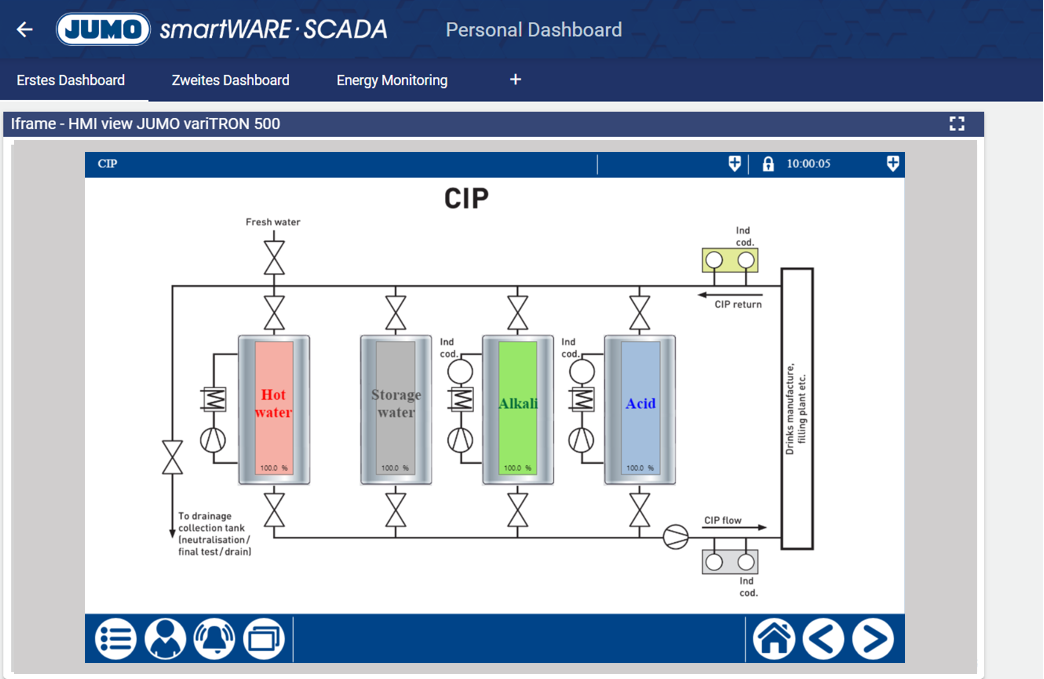
7.) IP addresses can now also be entered in the widget: Iframe. This makes it technically possible to display the Web Visu of a variTRON automation system in the dashboard.
8.) Bug fix and system maintenance