
The dashboard
The dashboard display varies depending on the selected configuration.
The following icons and buttons are listed in the upper area of the dashboard as standard:
Icon/button | Meaning |
|---|---|
 | Pages Visualization of the process data on multiple pages and different widgets. |
 | Generation of reports based on report templates. |
 | Modification of the time range to be shown for visualizing process data from the past. |
 |
|
 | Full-screen mode Switch to full-screen mode (can also be done using the F11 key). |
 | "Page X" settings Settings regarding the components of the relevant page. They can also be made using the settings in the relevant widget displayed: |
  | Save settings Settings made on the relevant page are saved. Once changes have been made, a green dot is shown on the save symbol. The new settings must be saved in order for them to be adopted the next time the dashboard is opened. |
What is a widget?
A widget is a predefined visual element, which is designed to display process data or information.
Initial steps
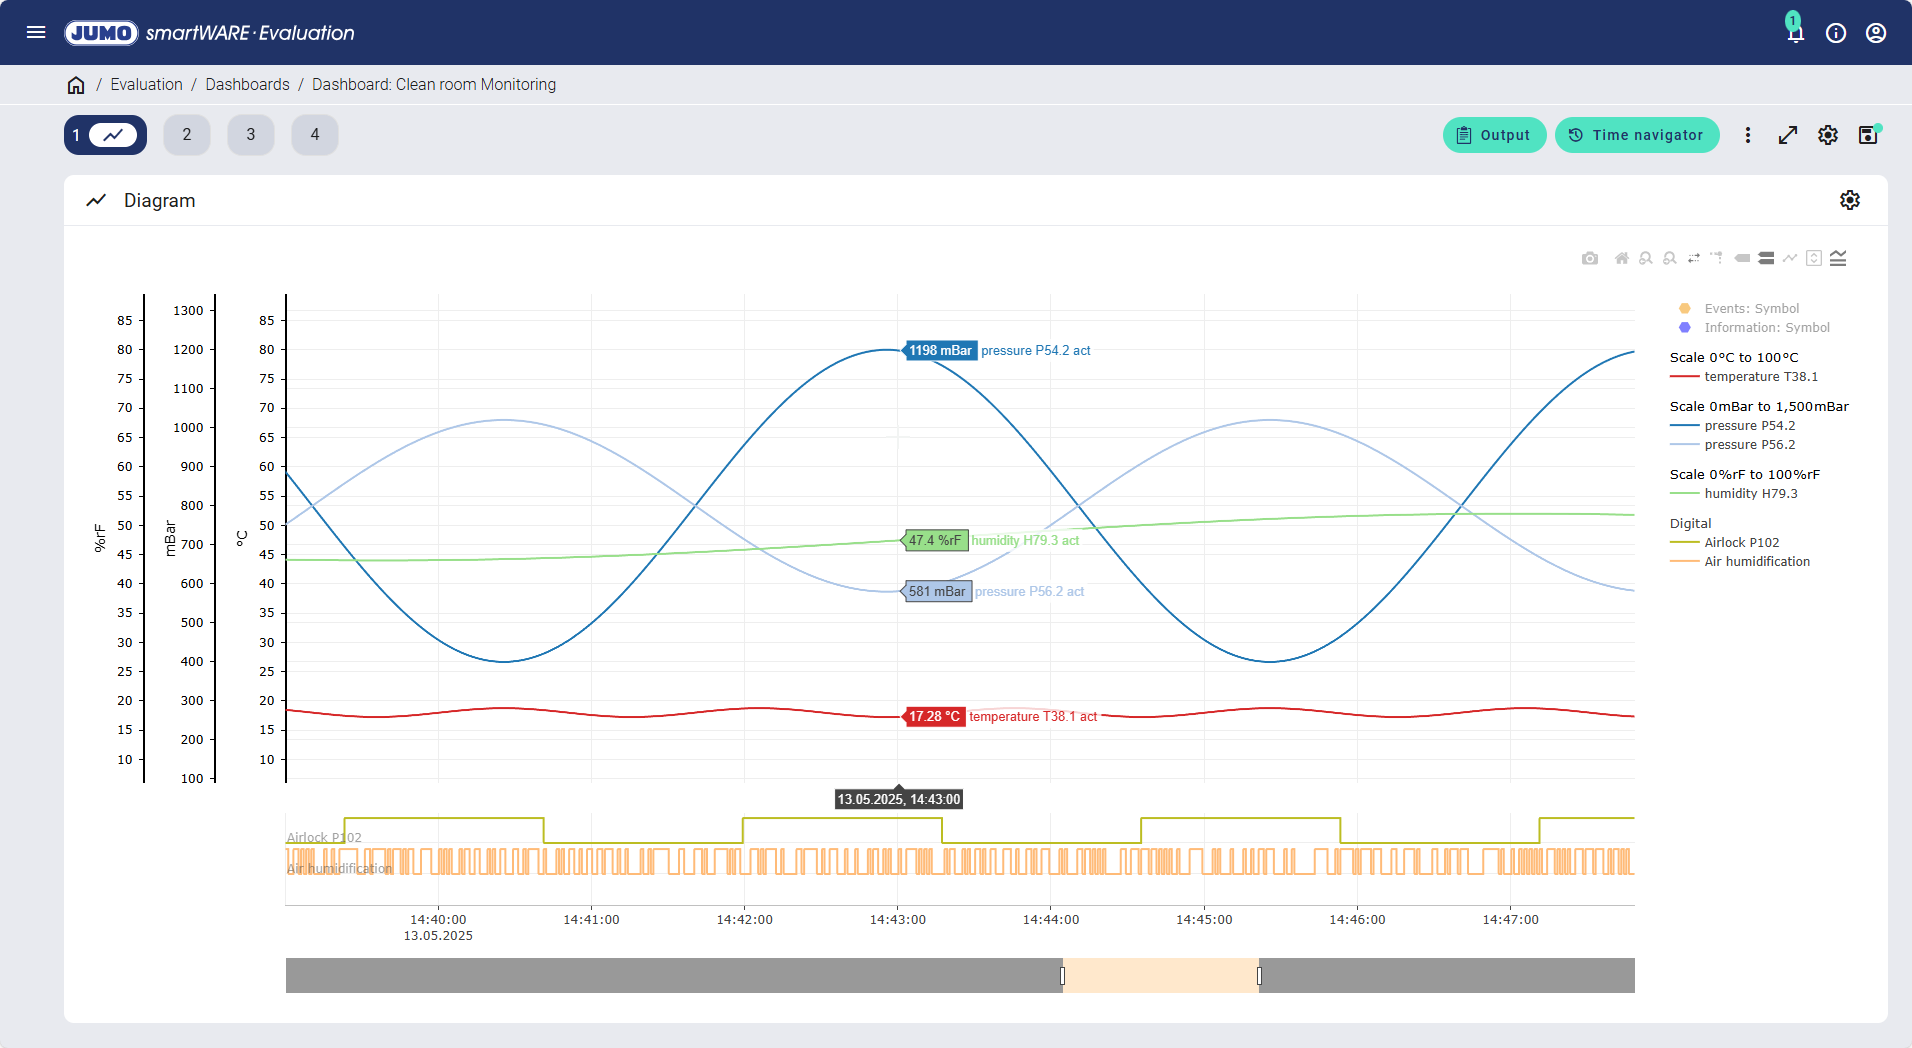
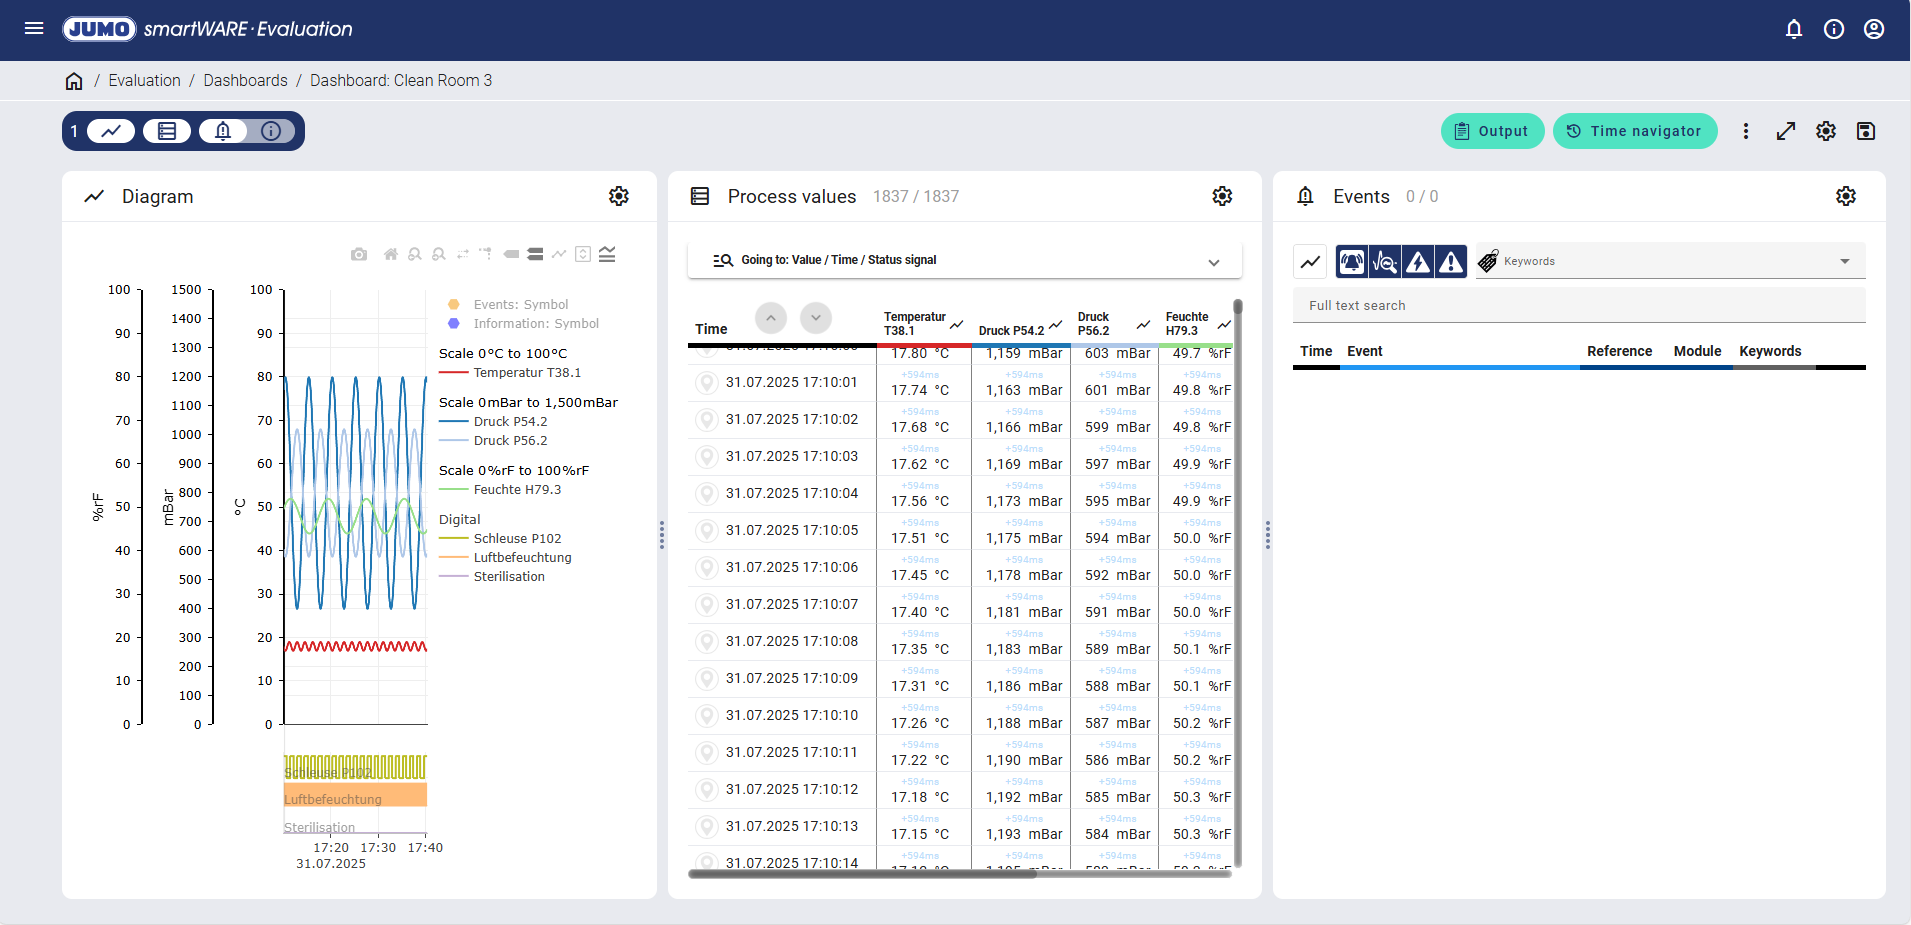
Once the dashboard has been set up successfully, evaluation of the process data can start. The first time it is called up, the dashboard is displayed as follows:
In order to gain a better overview of the process data evaluation, it is recommended that you set up so-called "Pages". Multiple pages can be shown per dashboard. It is therefore possible to display a diagram to graphically visualize the process data, for example. Other pages (e.g. page 2 or 3) can then be used to visualize various widgets such as process data, information, batches, or events.
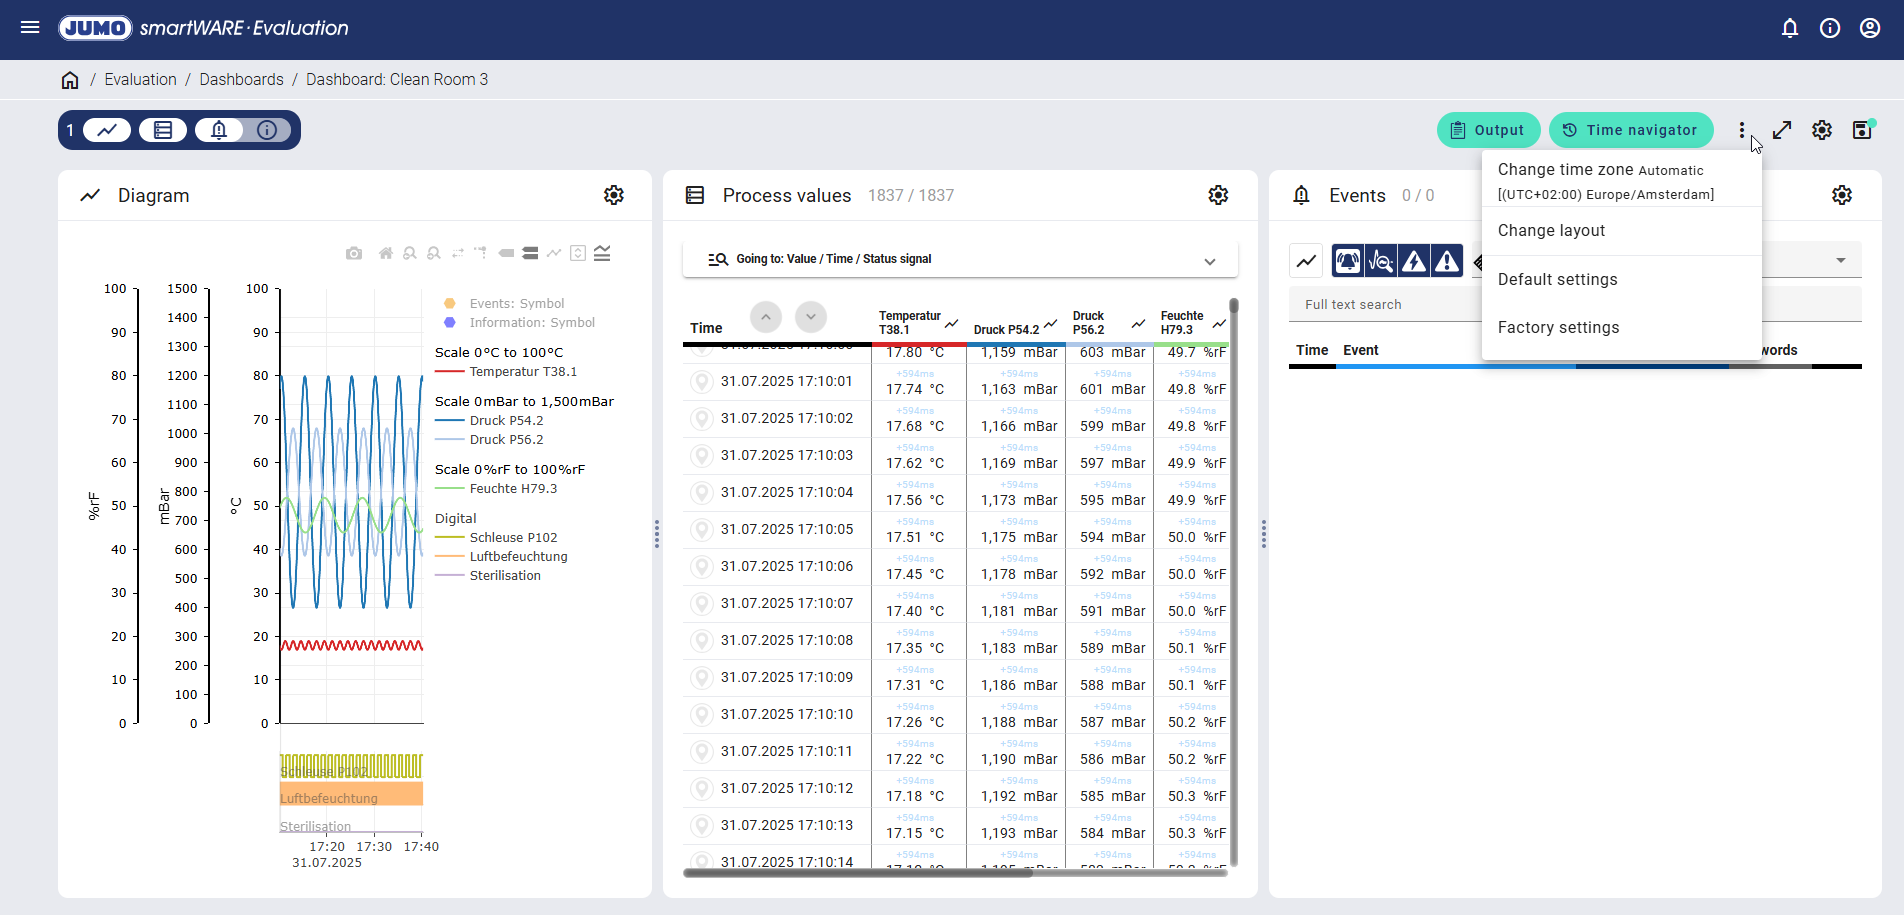
The pages can be adjusted using the "Further options" icon under "Change layout".