
Administration (Service)
JUMO smartWARE Evaluation
Home / Setup/data overview / Service / Administration
Data backup of the JUMO smartWARE Evaluation configuration
Data backup of configurations is performed automatically, but can also be performed manually using the "Starting data backup" button.
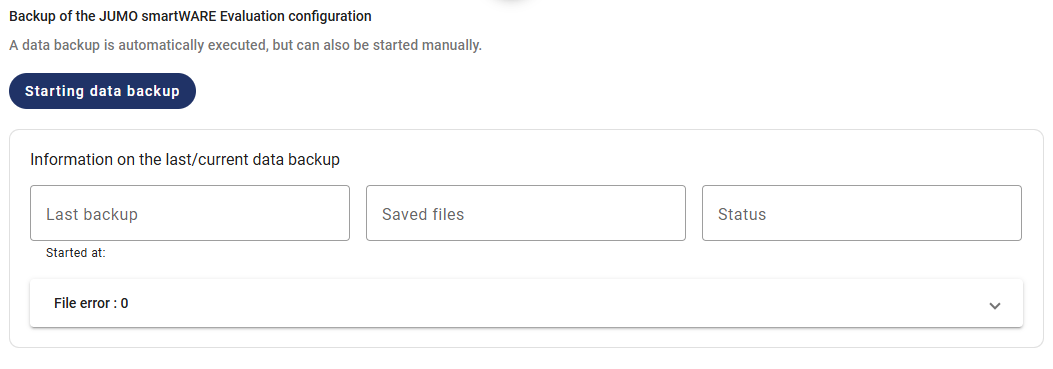
The time of the last data backup and the number of saved files are displayed. The status indicates whether the data backup was successful or errors have occurred. The number of files with errors is displayed and all files with errors can be viewed using the drop-down menu.
Log files
JUMO smartWARE Evaluation activities are saved in log files.

The scope of the log files can be set under log level. Either the "Normal" or "Detailed" levels can be selected. The current setting is highlighted in dark-blue.
"Normal" is recommended for reasons of disk space.
Database
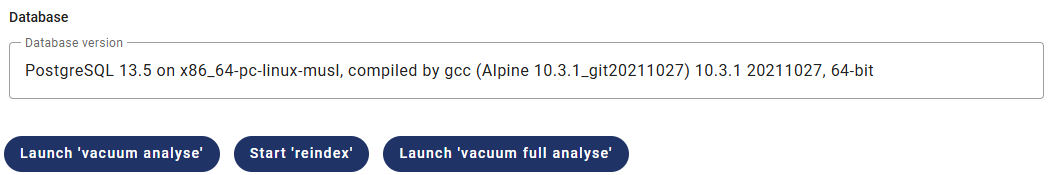
The current database version is indicated under database version. The three buttons can be used to initiate a database-internal repair if required.
These functions should only be performed in consultation with the Service department.
Data in Datastore

Data stored in the Datastore (cold data) can be retrieved again using the button.
This function is useful if data gaps are displayed in the data status, even though there is data in the Datastore.
Notes in Datastore
The number of notes that were not successfully transferred to the Datastore are displayed. Only notes that were transferred to the Datastore are taken into consideration during data backup or archiving.
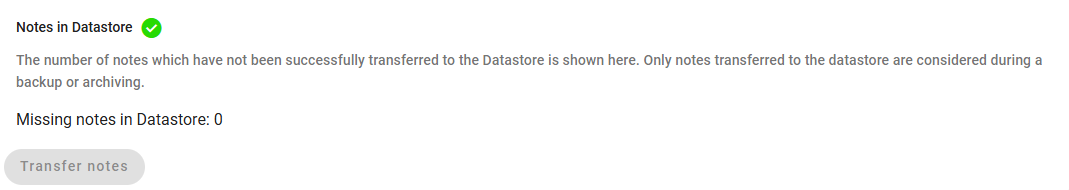
The notes can be transferred to the Datastore using the button.
Report settings
Global settings for reports are made here.

Automatic repetition of incorrect report jobs and automatic generation of missing report documents are activated by checking the options.
Templates for standard output
All existing templates that can be selected during the output of dashboard or batch evaluations are listed.
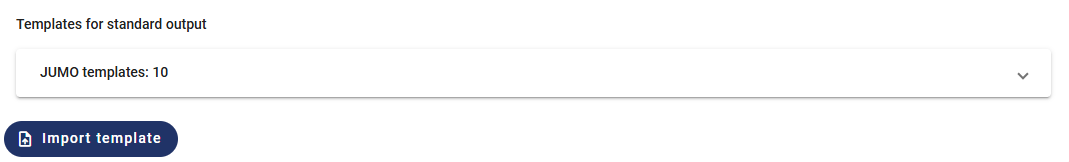
The number of existing templates is displayed. All templates can be viewed using the drop-down menu.
The "Import template" button can be used to add a new template via drag and drop or the "Select standard template for upload" can be used to add and import them.
Report requests
All ongoing report requests are listed. The report requests include report jobs, dashboard outputs, and batch outputs.
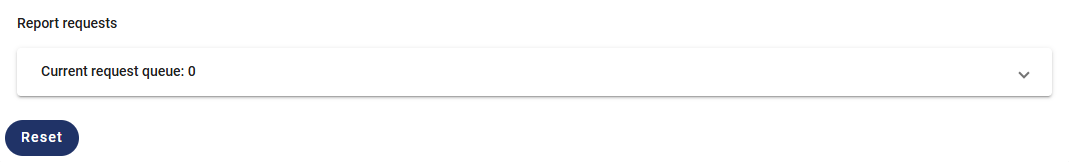
The number of existing report requests is displayed. All report requests can be viewed using the drop-down menu.
It may be the case that report requests become "stuck". In this case, the requests can be reset by clicking on the button.
Service file
Information about the system is compiled in a file.
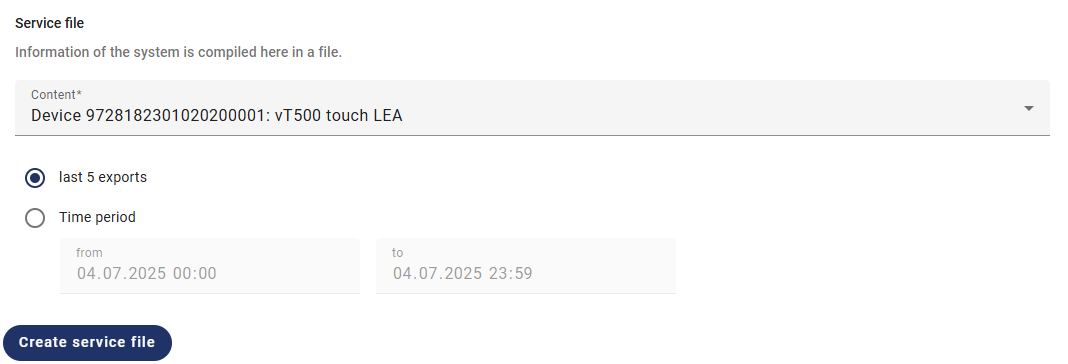
The relevant device can be selected using the drop-down menu. The service file can be created from the last 5 exports or for a certain time range.