
452.6.0.0.59 (27.05.2025)
General information
Fundamental overhaul of the design.
Installation
Simplified installation of JUMO smartWARE Evaluation.
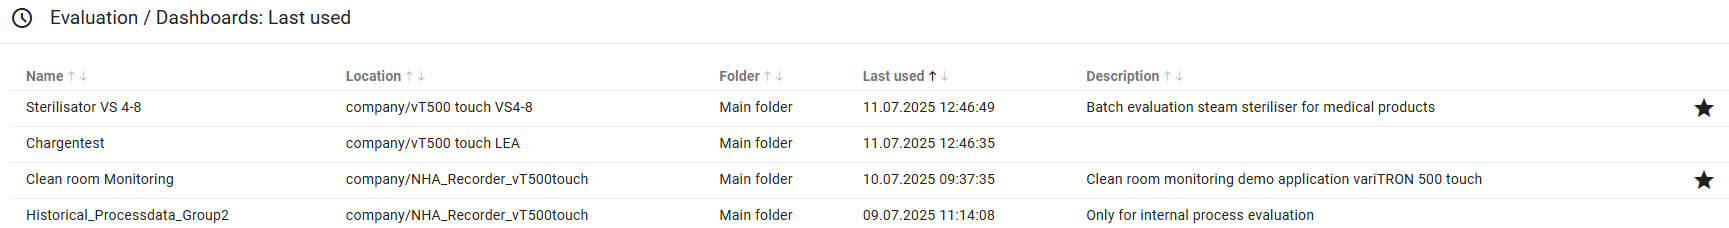
Homepage
The last used dashboards are displayed on the homepage.
Notifications
A new menu for messages to the user has been added. The bell symbol ![]() at the top right on the homepage lists the messages. The user can also be notified by email if desired.
at the top right on the homepage lists the messages. The user can also be notified by email if desired.
Combined batches
There is the option of combining multiple batches. To do so, the grouping option has been added under "Evaluation / Batches".

Go-to function
The operators for analog and digital channels have changed.
Dashboards
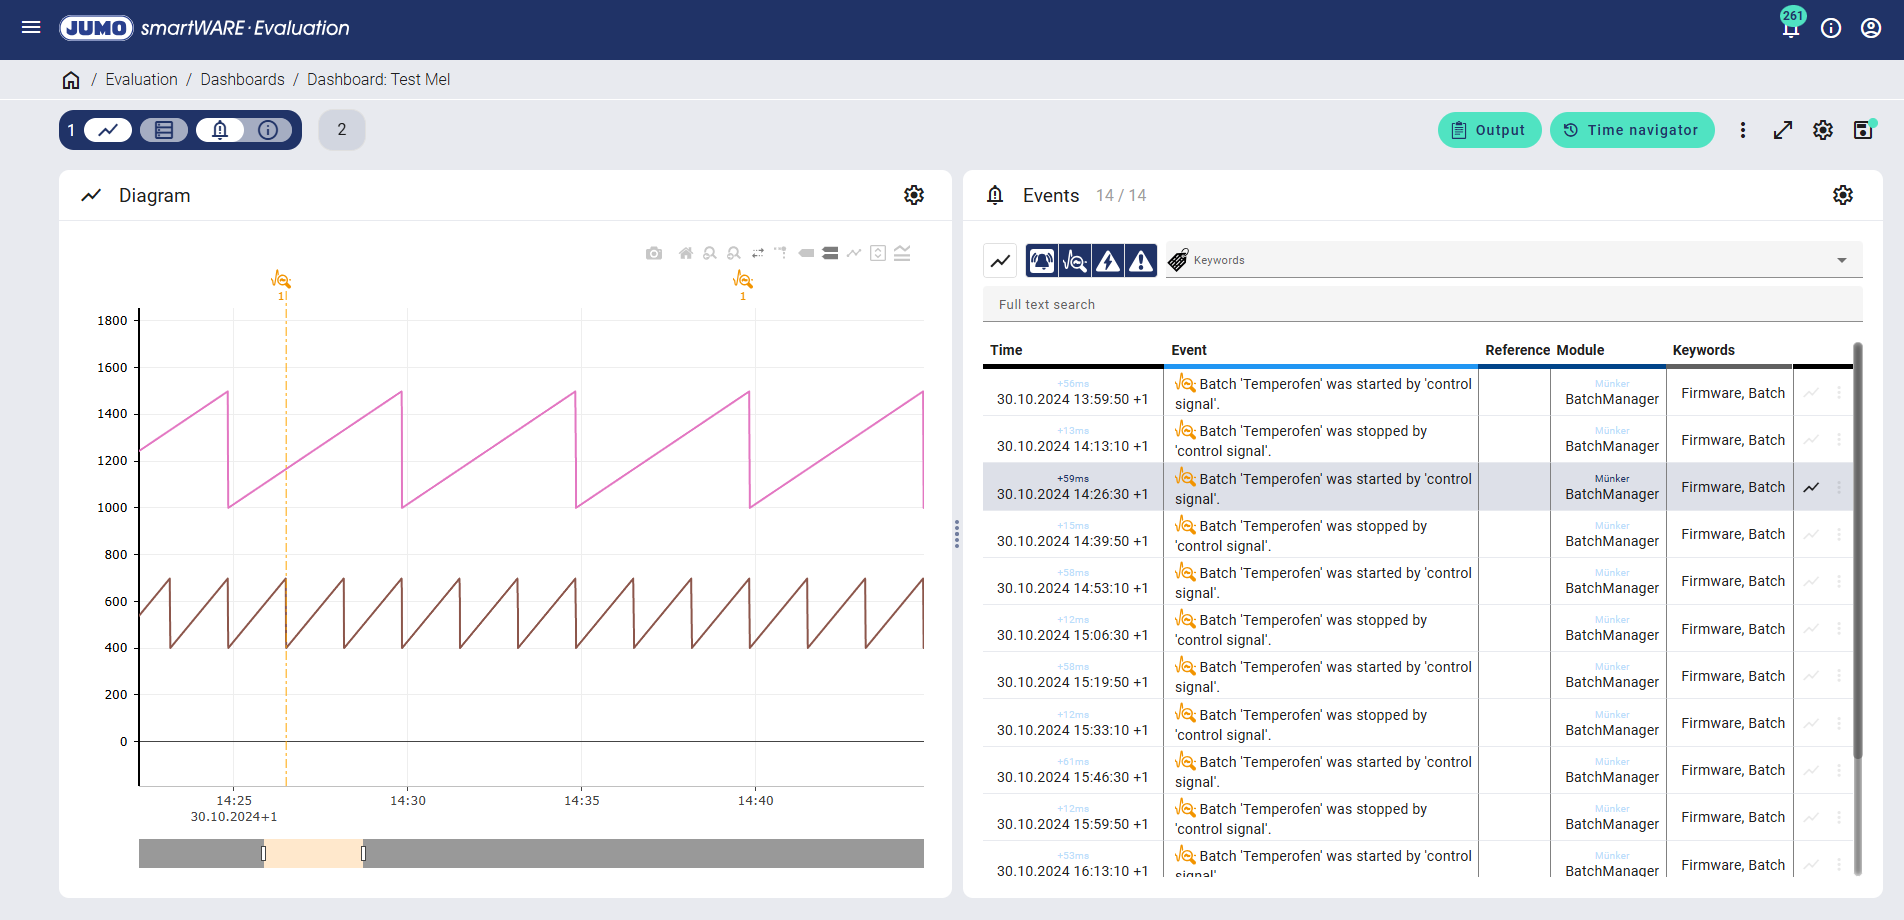
The average value, the min. value, and the max. value can now be displayed in the diagrams and the process value tables in addition to the current value. Envelope diagrams are used for this in the diagram. The values that are displayed and whether envelope diagrams are to be shown in the diagram is defined in the dashboard settings.
Information is now also available as a data source alongside diagrams, process values, events, and batches. Information can be added as a note in diagrams, in process value tables, in event tables, and for batches.
Information is displayed as a small mark in the process value table and can also be displayed in the diagram if desired (legend settings).Events are now also shown in diagrams. Optionally, they can be hidden using the legend settings.
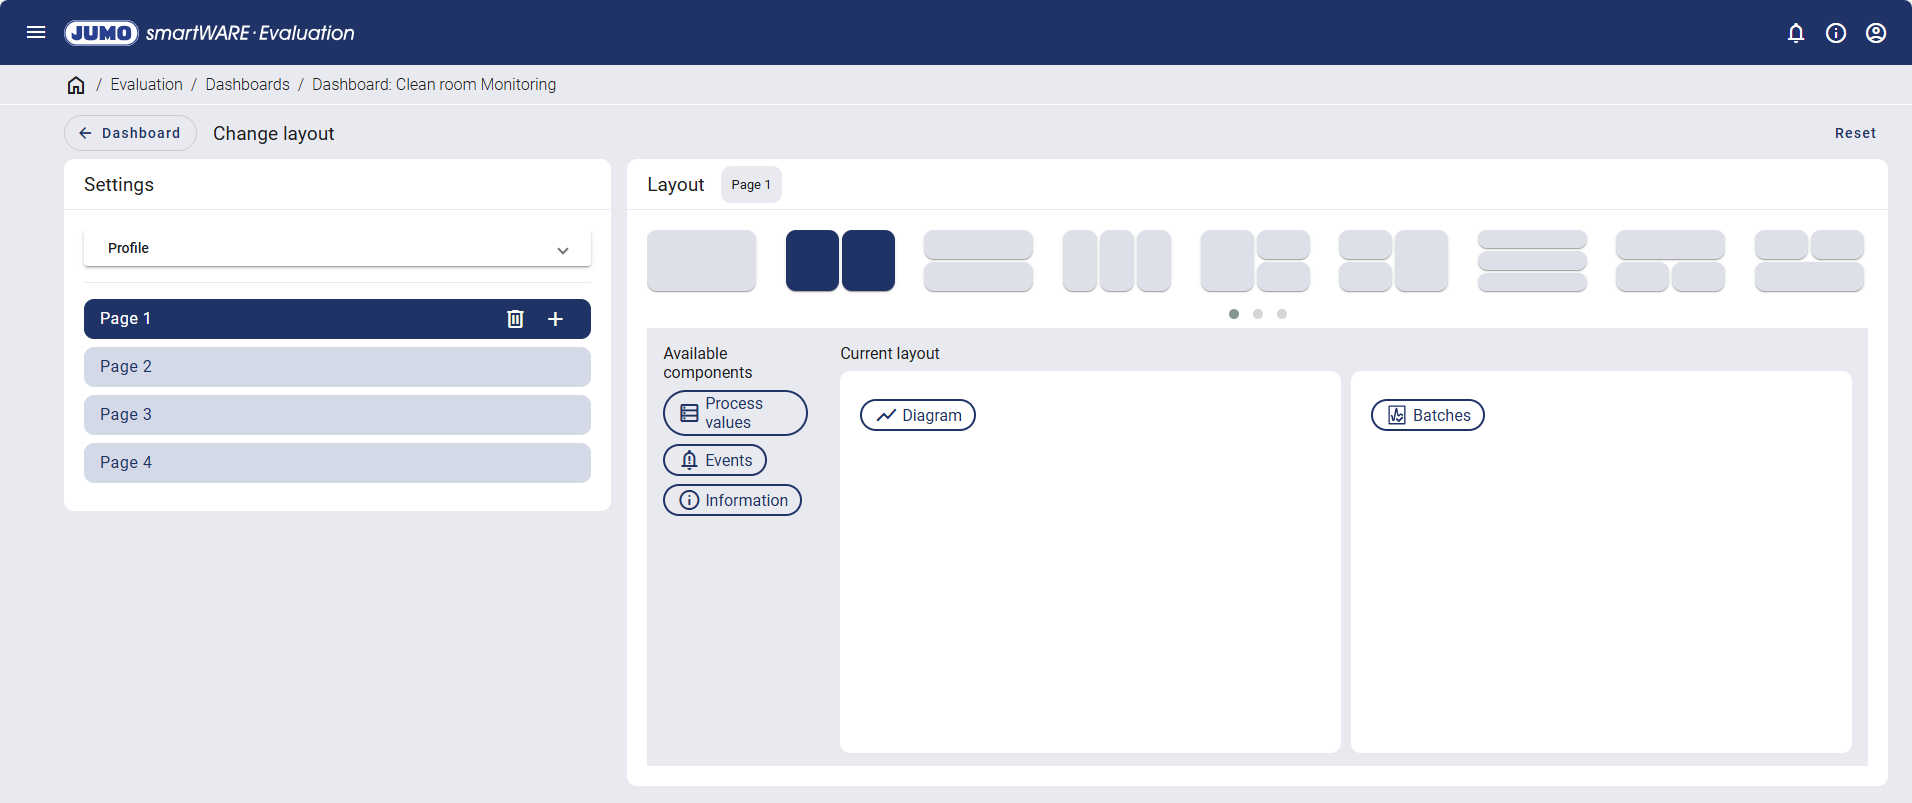
Components of the dashboard can now be arranged flexibly using the layout settings and arranged as wanted.
Output of dashboards / Batches
There are additional standard templates and file formats. The new information data source can also be selected here.
In addition to the current value, the average value, min. value, and max. value can also be output here in the output.
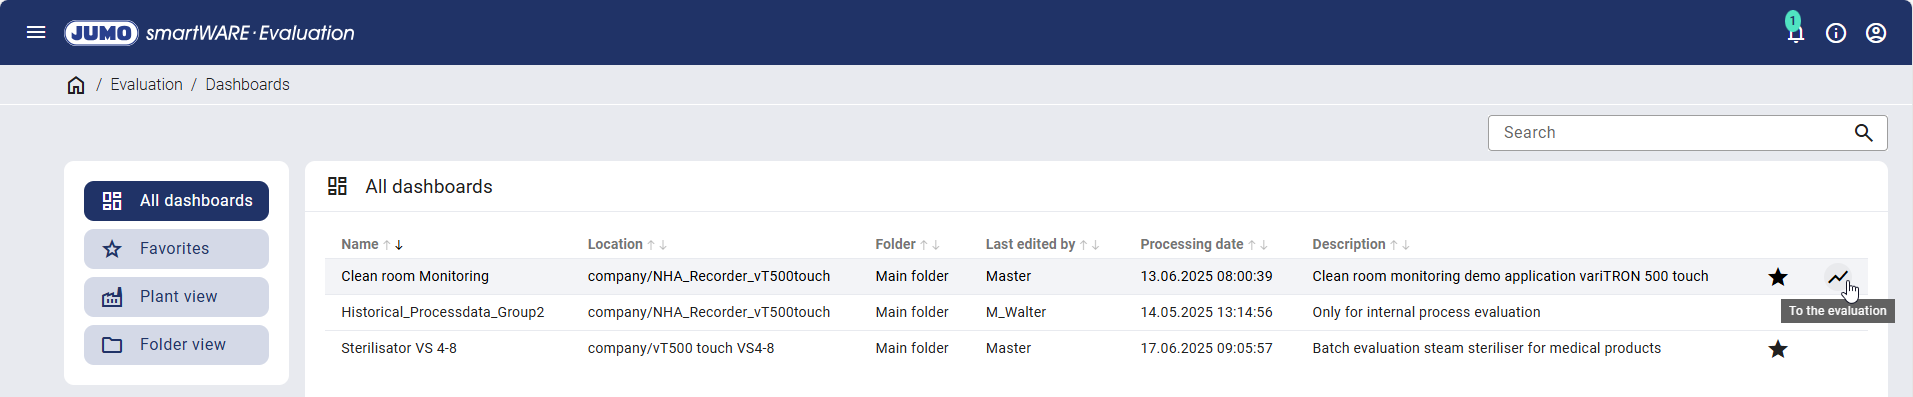
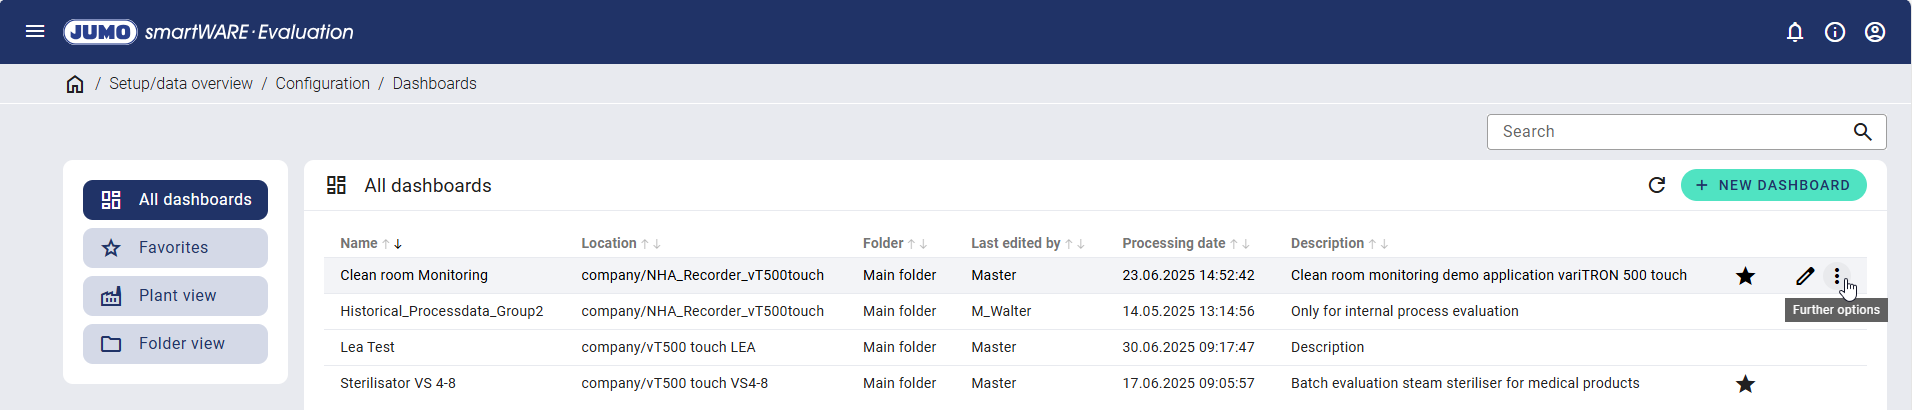
Evaluation / Dashboards
The dashboards are no longer shown as tiles, but as a table. In addition, favorites can be defined and dashboards shown in the plant and folder view. The user can create sub-folders themselves (under "Configuration > Dashboards").
Evaluation / Batches
The grouping option has been added to enable batches to be combined.
If a batch is to be evaluated, this is no longer carried out using the "Next" command, but rather the "Individual evaluation" icon
 . A window in which the dashboard is selected then appears.
Multiple batches can be selected using the box on the left-hand side.
Evaluation / Reports
The report overview page has changed. Functions such as delete, display, and download are now available to the right of every report.
Multiple reports can be selected using the boxes on the left-hand side. A key combination is no longer required.
Configuration / Dashboards
The dashboards are no longer shown as tiles, but as a table. In addition, favorites can be defined and dashboards shown in the plant and folder view. The user can create sub-folders themselves.
Only the channels from the current configuration can be displayed when creating or editing a dashboard under "Groups and channels" with the command "Only channels with the latest configuration".
Configuration / Report templates
The report template overview page has changed. Functions such as delete, display, and download are now available to the right of every report template.
Reports are classified into the categories time period, batch, and batches depending on the triggers defined.
The new information data source can also be selected for report templates.
Configuration / Reports
The time zone can now also be defined for the report in the options tab. It is also specified in the report as standard.
A joint batch evaluation can be selected for the report trigger.
The new information data source can also be selected for reports.
The user can set up notifications for when a new report has been created. The message is displayed in the notification window on the homepage. Optionally, the user can receive an email that includes the generated report as an attachment.
Service / Report jobs
Multiple report jobs can be selected using the boxes on the left-hand side. A key combination is no longer required.
Service / Disk space
All the devices are no longer displayed under "Disk space per device", but rather the desired device must be selected from a drop-down menu.
Service / User management
New menu for managing users and assigning rights. New users can be created there and roles created and assigned. An email address which notifications are sent to automatically if desired can be added for each user.
Datastore / USB import
New menu for the newly created option of importing data from the device into JUMO smartWARE Evaluation by USB flash drive.
Datastore / Devices
The data buffer fill level and whether the relevant device is currently online or offline is also displayed in the "Device overview". If there are error messages, they are also displayed here.
Datastore / Disk space
All the devices are no longer displayed under "Disk space per device", but rather the desired device must be selected from a drop-down menu.
In addition to the disk space for the data carrier and device, the disk space for the data backup and disk space for archiving are now also displayed.
Datastore / Archiving
The disk space required for archiving is now no longer shown under "Archiving", but rather under "Datastore > Disk space".
Software info
Another menu has been added under "Software info". The information that was previously under "Info" is now divided between the two menus "Info" and "License information".