
How do I create a report template?
Five steps to the report template
New report templates can be created in the Report Templates section. This requires duplicating one of the existing report templates.
JUMO provides standard templates. These are included in the basic configuration of the JUMO smartWARE evaluation.
After the duplicate of the template has been selected, it can be adjusted by clicking on the Edit button. This requires five steps.
Step 1 “General”:
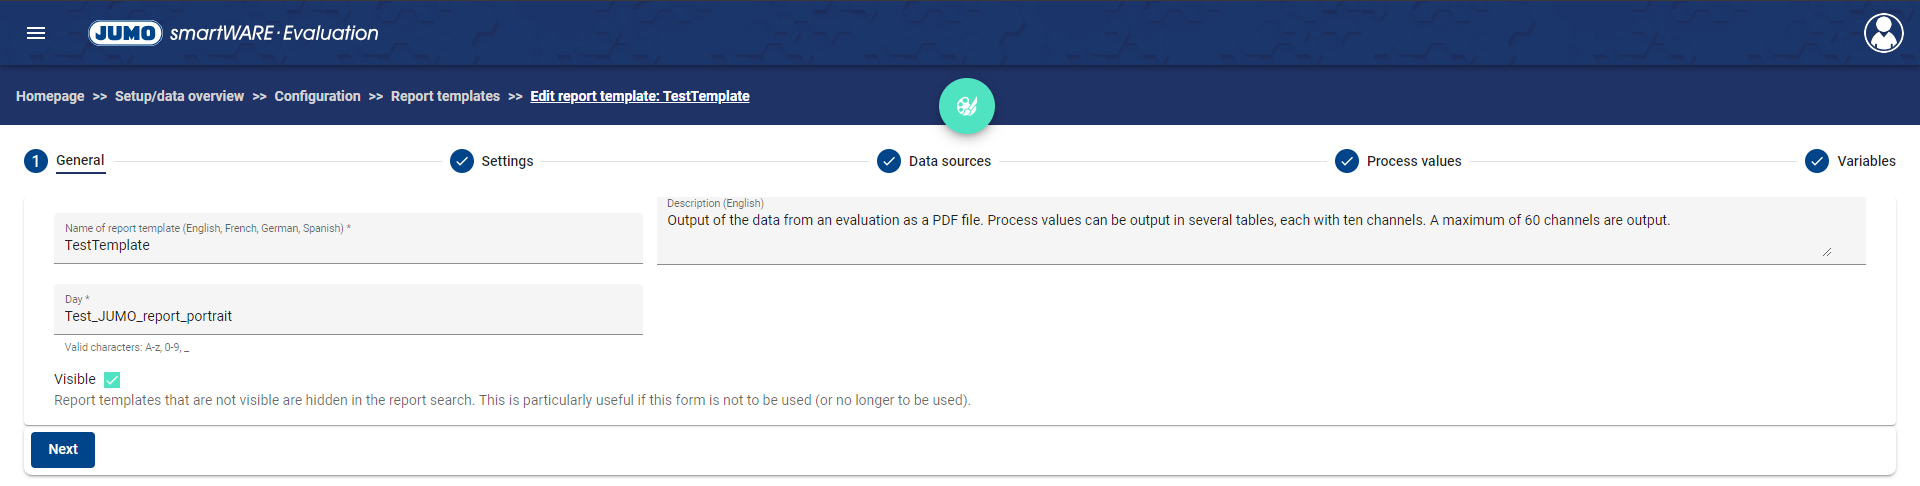
The following information of the template can be customized here:
Function | Description |
|---|---|
Report template name | How is the report template named in the system? |
Description | Report template description |
Day | The templates can be marked with a tag. |
Step 2 "Settings":
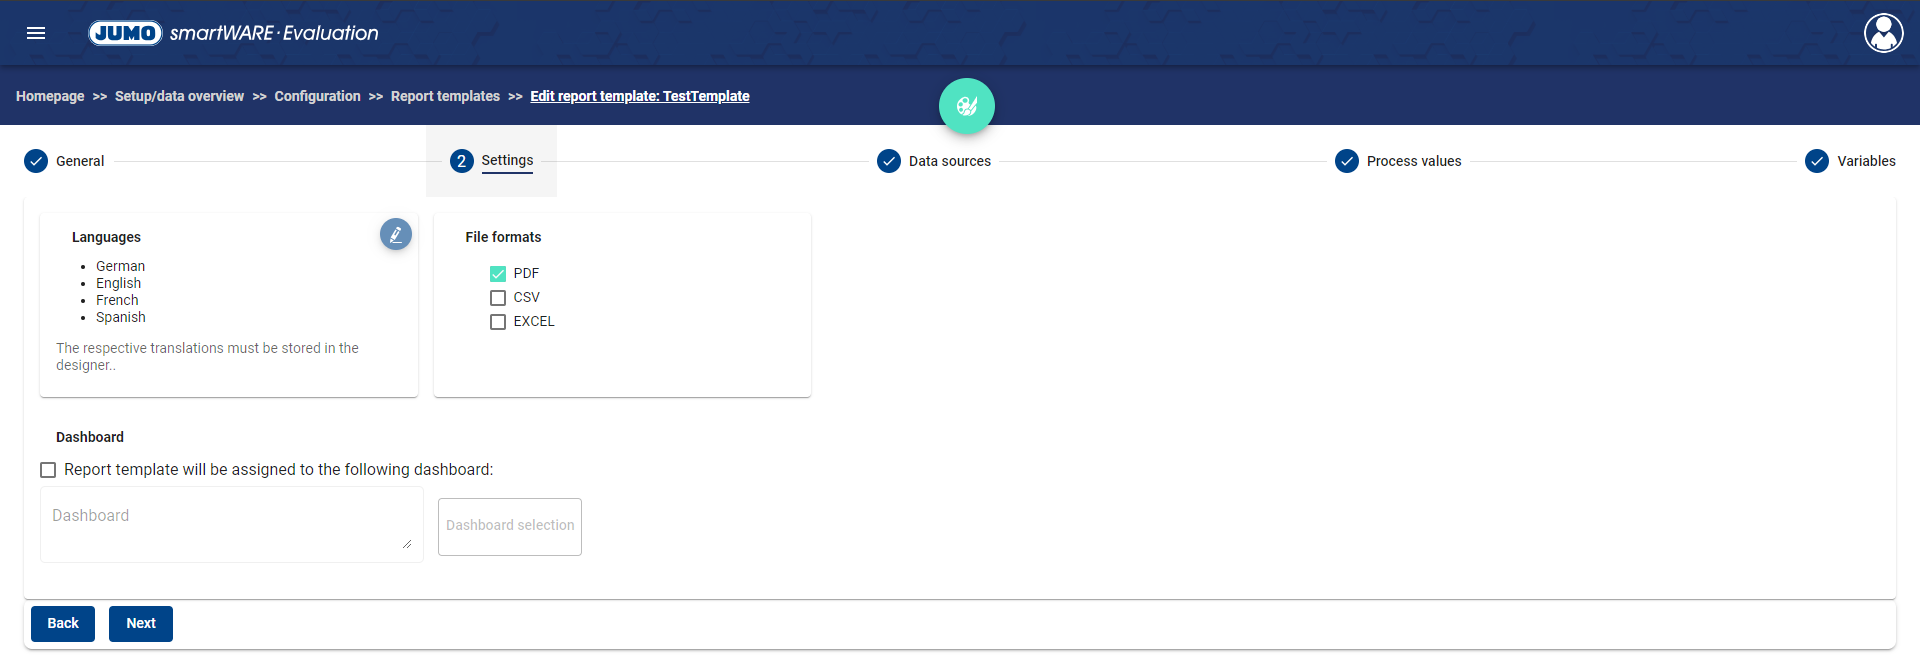
The following information of the template can be customized here:
Function | Description |
|---|---|
Languages | Any language can be selected here, as long as a translation has been saved in the designer. |
File format | Select whether the report template is available as PDF, CSV or EXCEL. |
Dashboard | Select a dashboard to associate the report template with. |
Step 3 “Data Sources”:
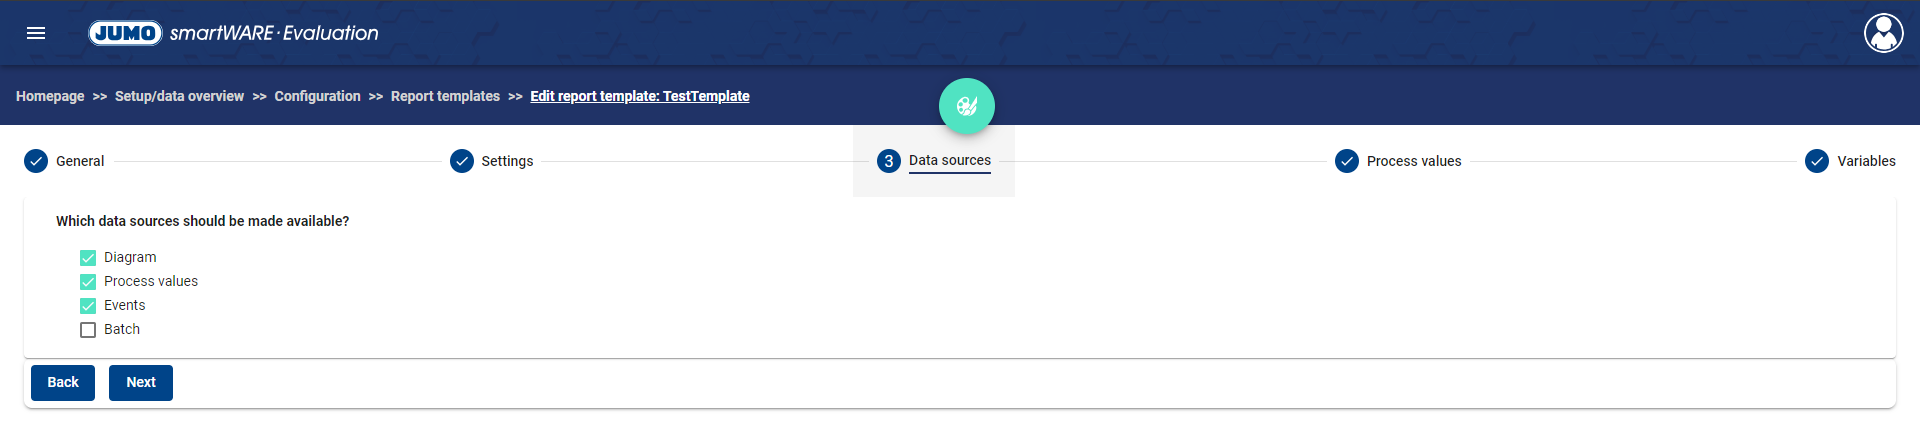
Decides which data sources are available for the report template. The following choices are available:
Diagram
Process values
Events
Batches
Step 4 "Process Values":
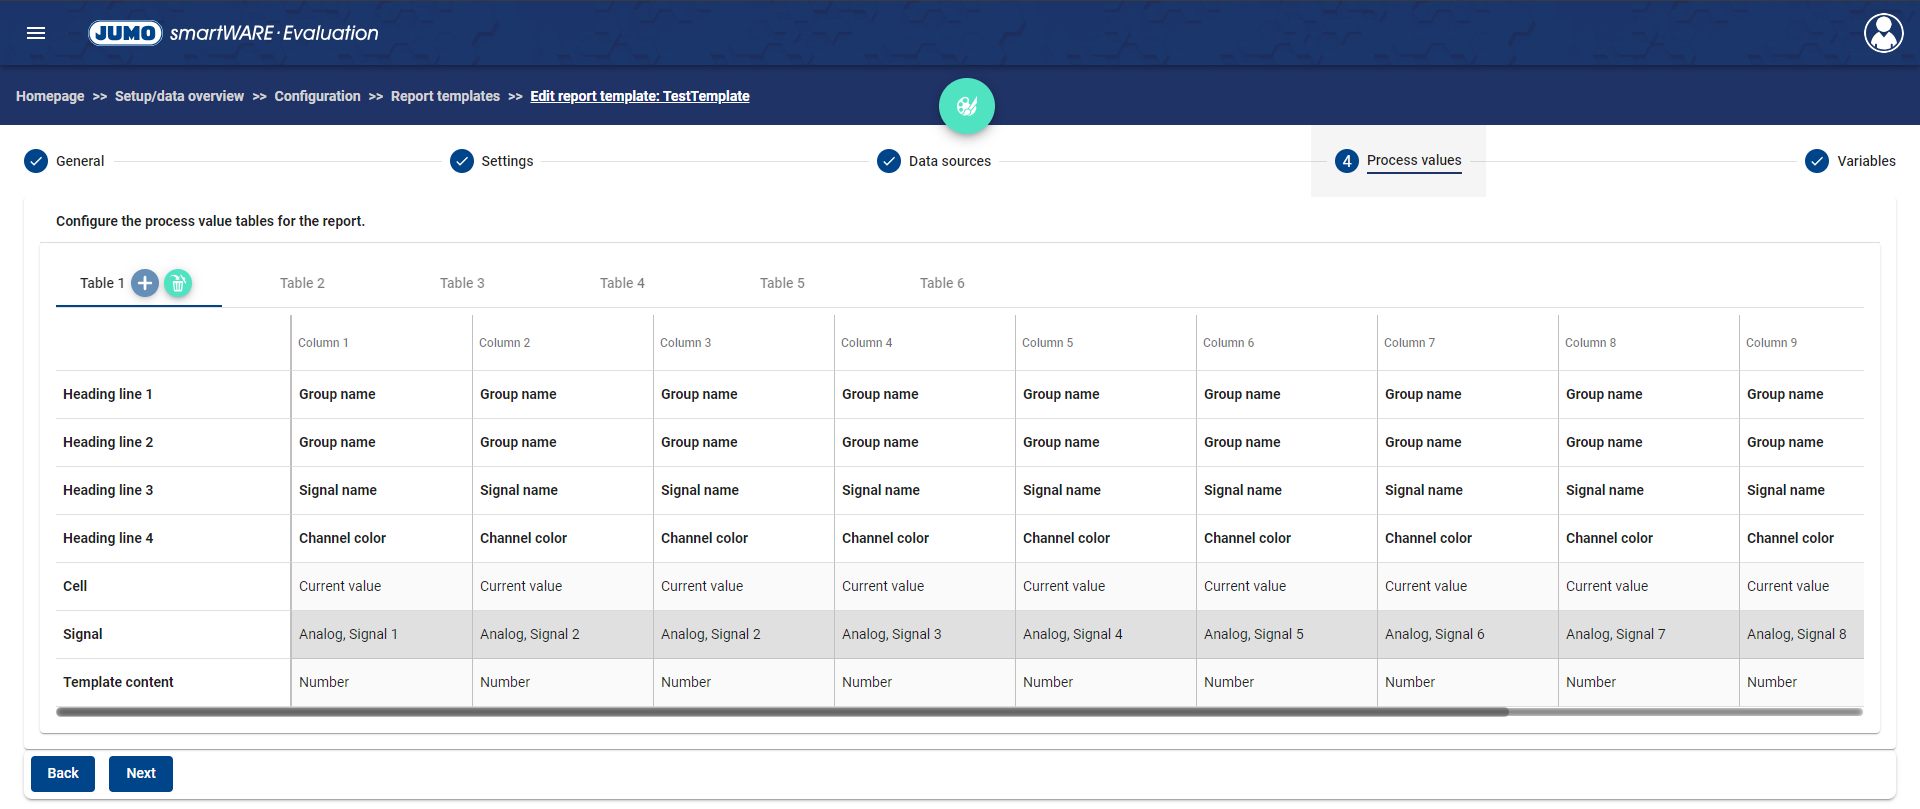
The Process Values step can be used to define an individual process value table.
Click the + in the table area to add a new table to the report. Clicking the Delete button deletes the selected table.
The columns per table can be individually designed. As you move your mouse over a column, the options for the selected column appear. A new column can be inserted next to the selected one, and the selected column can be deleted or changed.
Clicking on Change Column opens a new window.
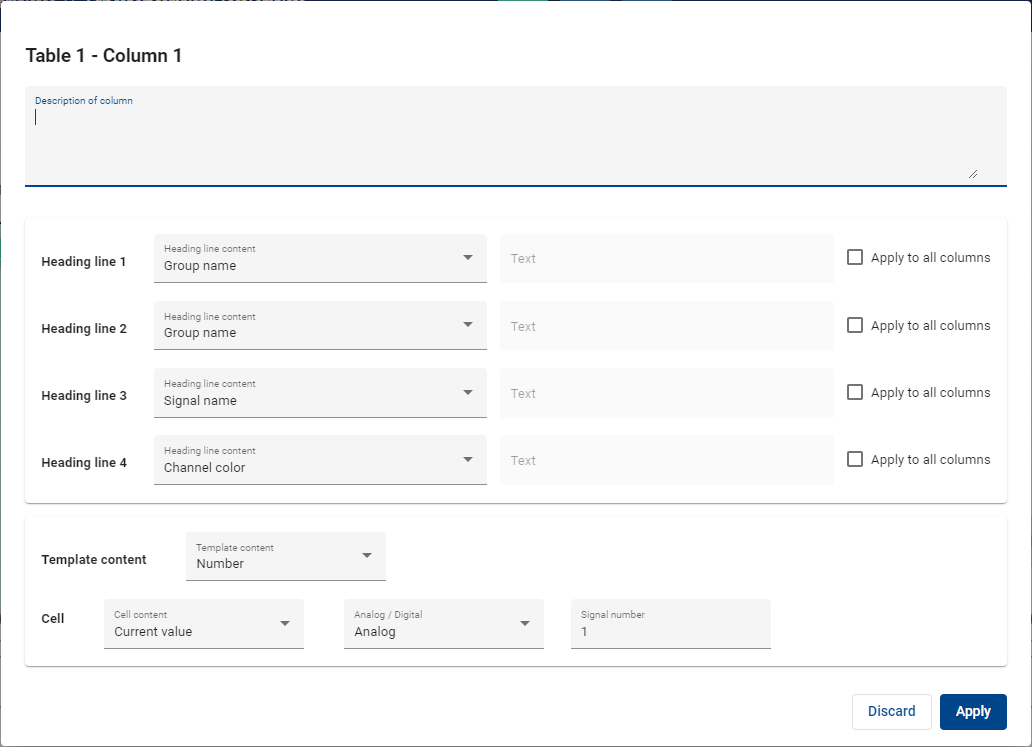
This window allows you to define the various columns. A description for the column can be added at the top of the window.
Clicking Apply to All Columns changes the header row to all columns in the current table.
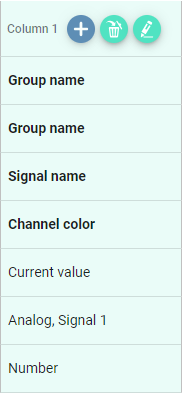
In the middle of the window, the header columns are defined. Here you can:
Free text
Device location name
Manufacturing number of the device
Group Name
Signal name
Signal unit
Channel color
Cell content
During Free Text Entry, the text field in the window is enabled for the selected header. There, the free text input can take place.
Behind each header is the ability to apply the selected content to all columns.
In the lower part of the window you can define the contents of the cell.
By clicking on the drop-down menu Default Content, the content of the cell can be restricted in advance. The following restriction options are available:
Function | Description |
|---|---|
No restriction | No restrictions on cell content field |
Number | The contents Current value, Mean value, Min value, and Max value can be selected in the Cell content field. |
Current value | Only Current value can be selected for the Content Cell field |
Average value | Only an average value can be selected for the Content Cell field |
Min. value | Only Min value can be selected for the Content Cell field |
Max. value | Only the Max value can be selected for the Content Cell field |
Unit | Only unit can be selected for the Content Cell field |
Timestamp offset | Only timestamp offset can be selected for the Content Cell field |
The following settings are also made here:
Analog / Digital Signal
Signal number
Clicking Apply applies the saved settings.
Step 5 “Variables”:
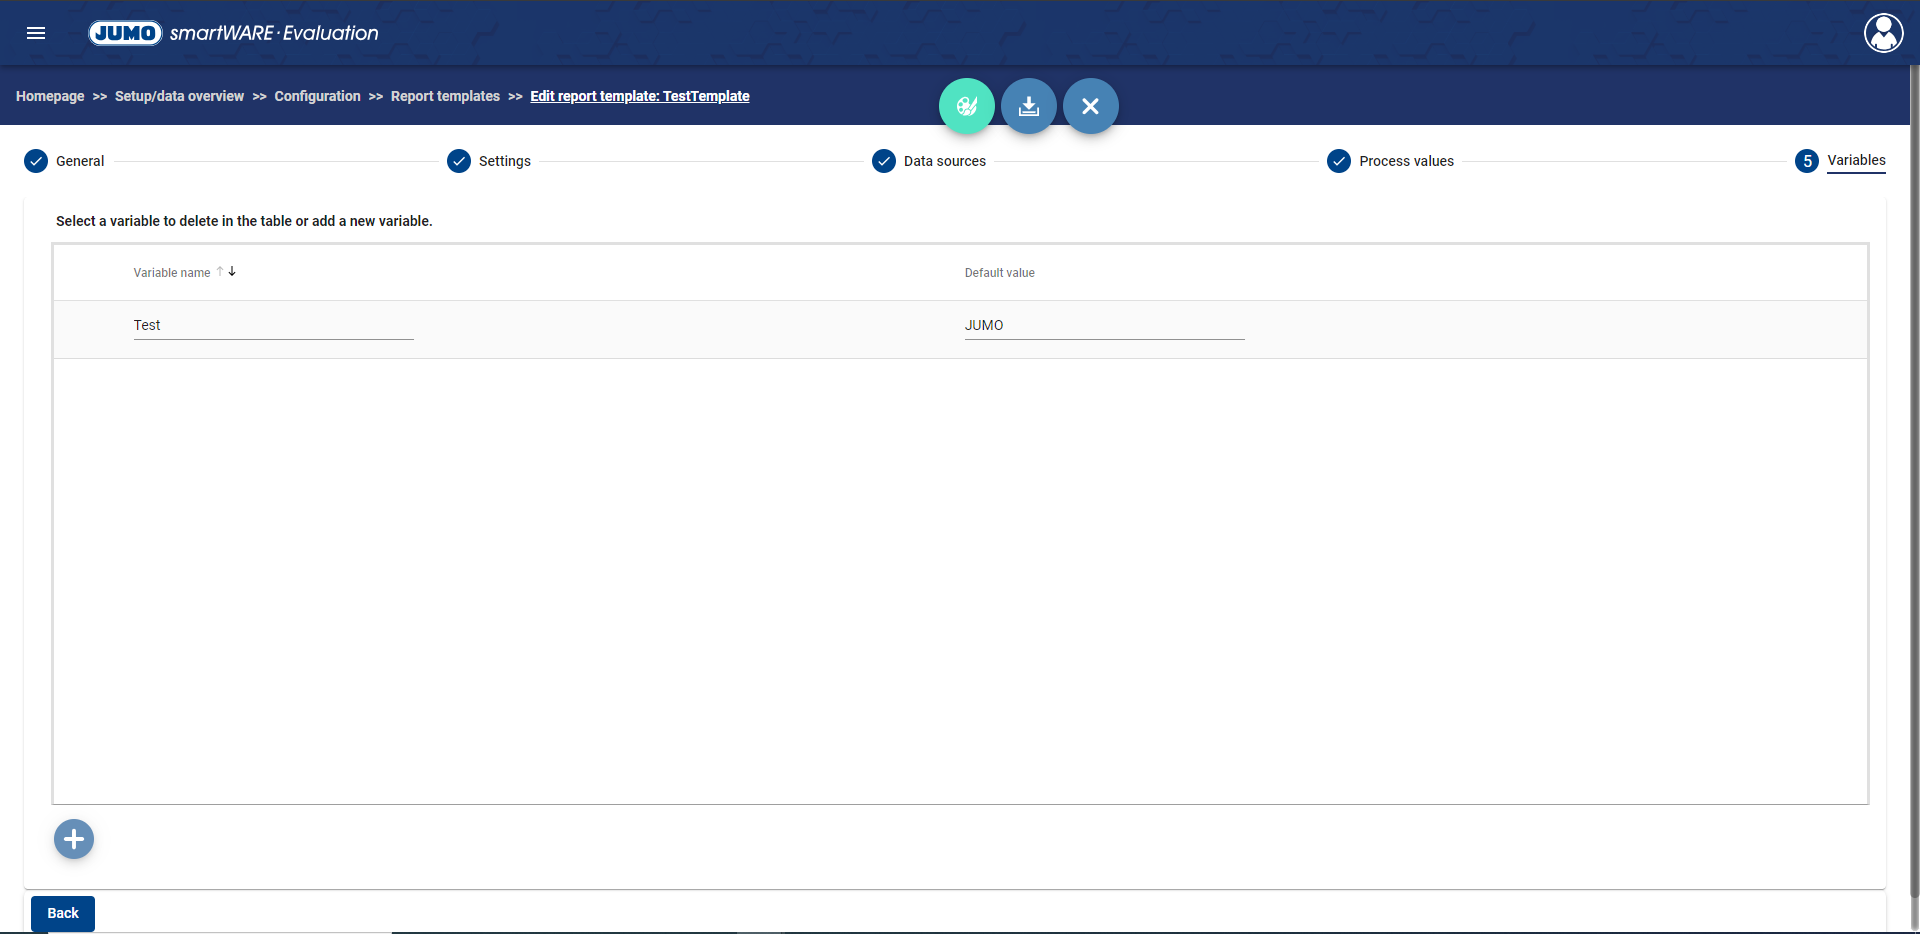
Within this window, you can define variables to which fixed texts are assigned here or in the report. This allows the text in the report to be changed without having to adapt the output form. The variables are provided in the designer as a data source (Datasource "variables") and can be assigned to any object.
Allows you to assign values to the variables, which will be overwritten in the final report.
Clicking the + below the table adds a new variable to the report template. The new variable appears immediately in the table and can be adjusted. The following options are available:
Function | Description |
|---|---|
Variable name | Name of variable |
Default value | Default value used for the variable. |
Designer
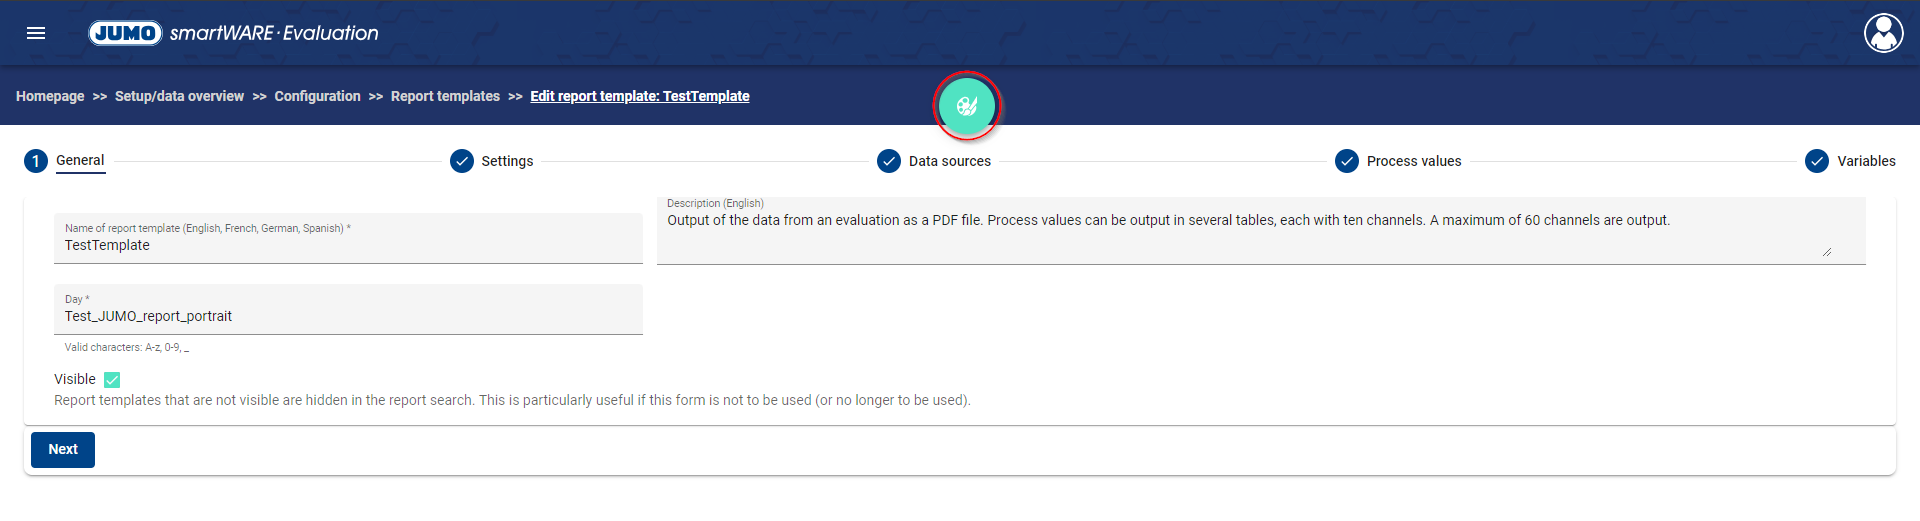
Clicking on the designer button opens a window in which the designer can be started.
The designer provides detailed configuration and design of your own report templates. Among other things, the company's own logo and CI can be incorporated there. In addition, the diagrams and all other content can be placed within the document as desired.
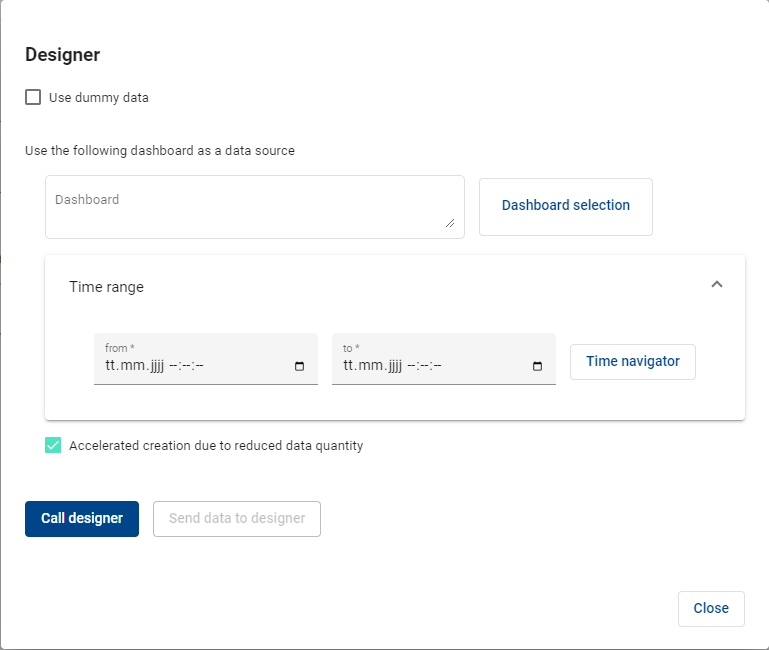
By clicking on the test data checkbox used, all subsequent settings are deactivated and test data stored in the system are used in the designer.
Alternatively, an existing dashboard can be used as a data source. To do this, click on Dashboard Selection to access the System/Device Overview and select the desired Dashboard. The Time Range pane defines the time period that you want to use as a data source. Once a dashboard and a time range have been defined, the Time Navigator can also be accessed via the time navigator button.
It is also possible to speed up the creation by checking the checkbox provided for this purpose, by reducing the amount of data in the designer.
By clicking on the Call Designer button, the designer application opens with the settings made in another browser tab. There, the template can now be customized and configured as desired.
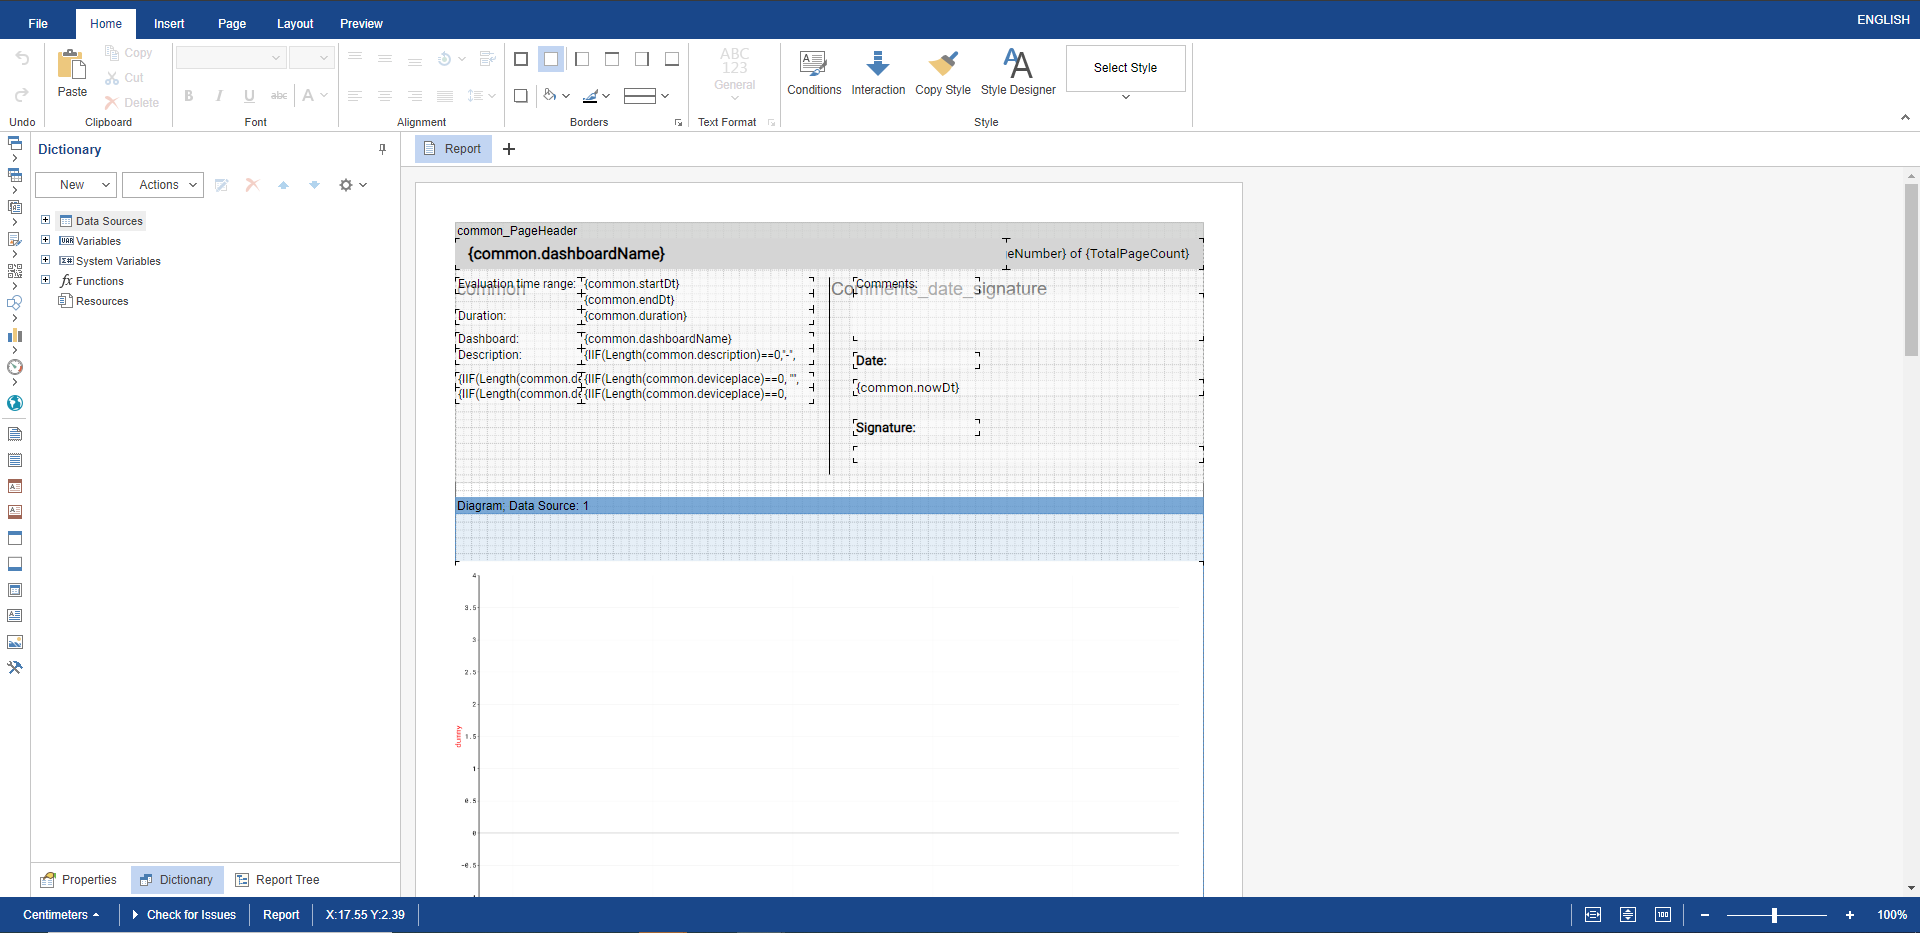
The designer itself provides help to assist with the application.