
Animation
With the JUMO Animator, we are able to display any animations in process images and integrate them in the cloud or SCADA.
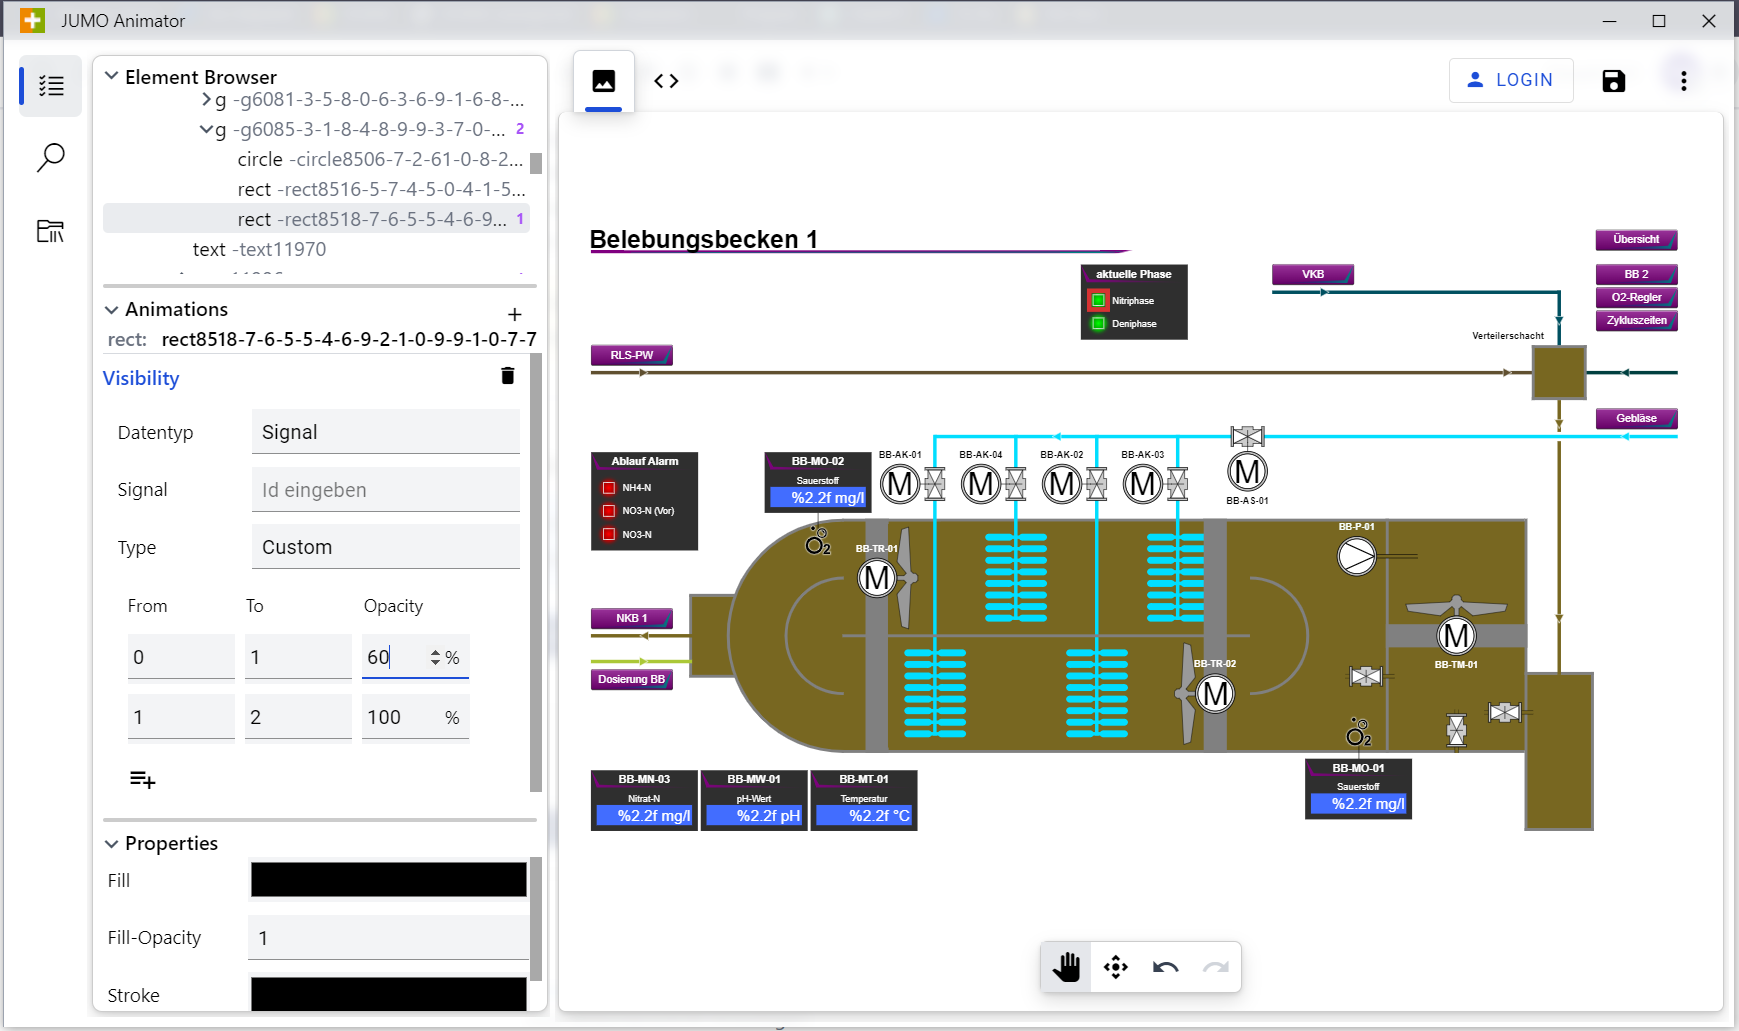
The JUMO Animator automatically recognizes whether the object is a shape or a text and provides corresponding animation options. The currently selected object is outlined in red.
Bar
The "Bar" animation is used to zoom in or out on objects. This can be used to graphically display filling levels, for example. Thus, the liquid in a container may rise or fall.
The inserted element has the maximum size and shows a certain range depending on the signal.
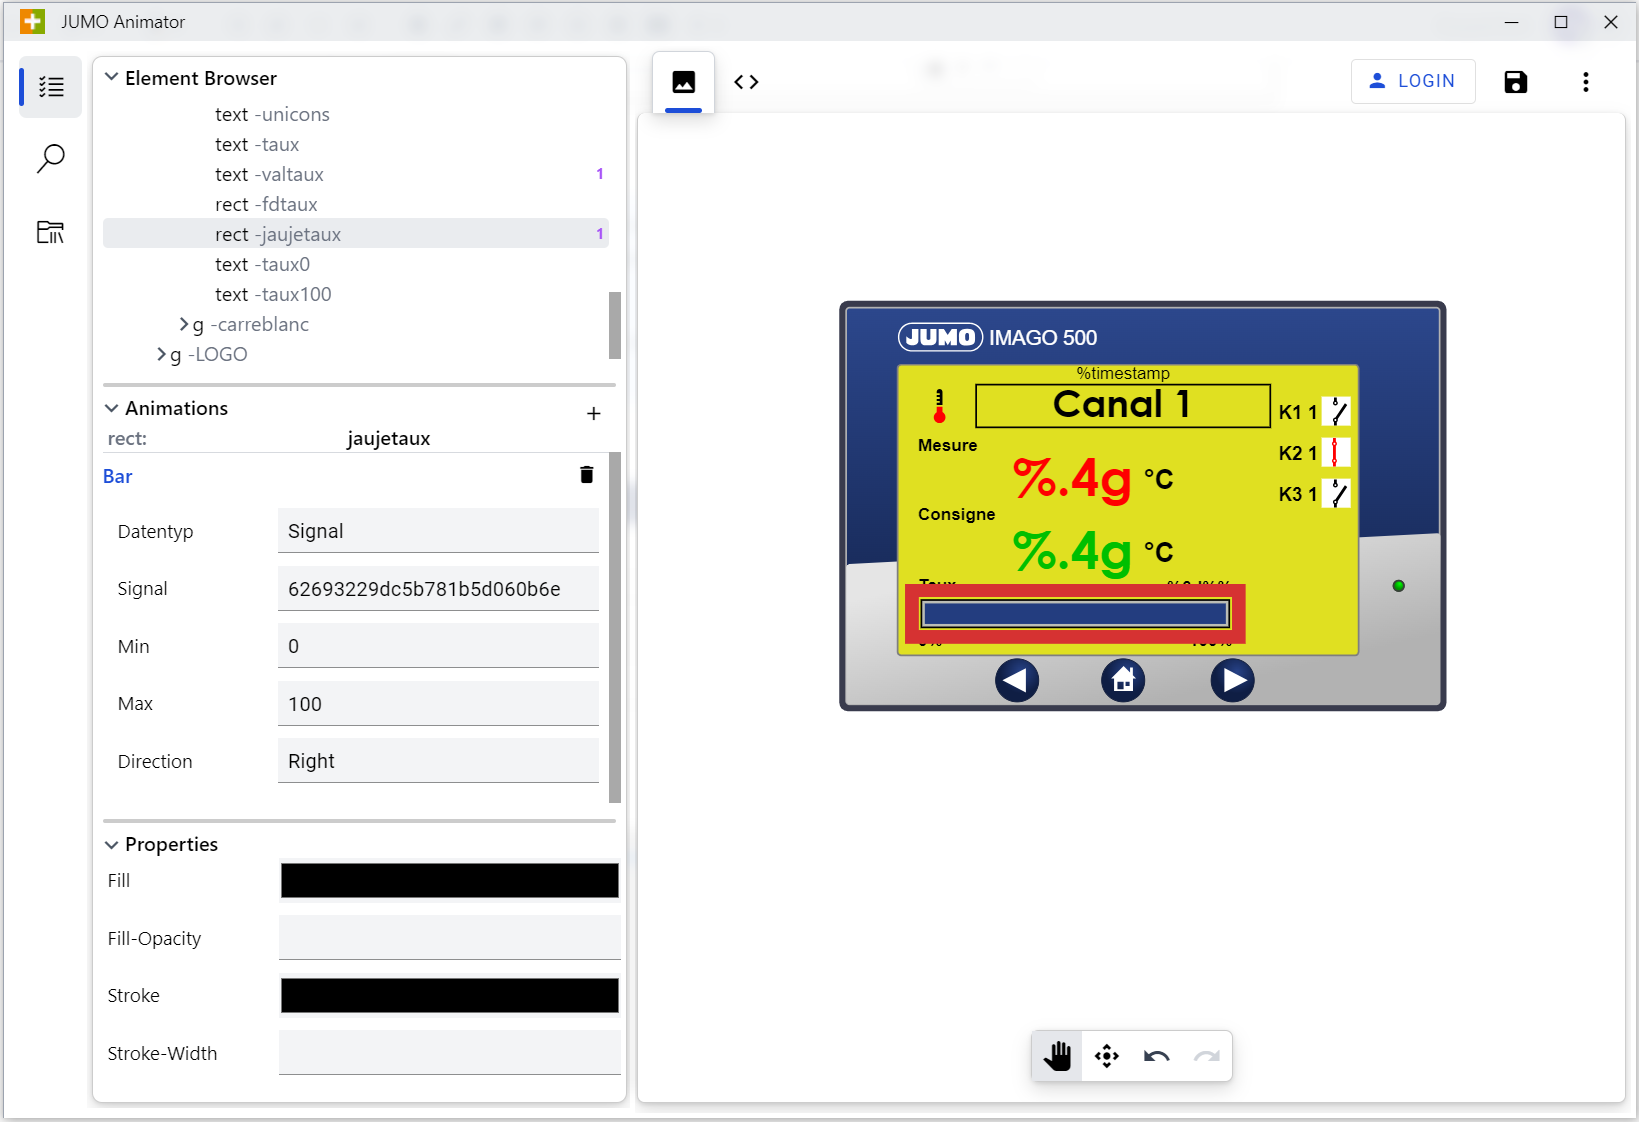
Bar example:
Attribute | Value | Meaning |
|---|---|---|
Signal | ID | The ID of the input value |
Min | e.g. 0 | Minimum value of the analog input signal. (mostly "0") |
Max | e.g. 30 | Maximum value of the analog input signal. (Boundary condition of the level to be reached) |
Direction | see table | Specification of the direction in which filling takes place. |
Other possible values for the "Direction" attribute:
Value of the Direction attribute | Meaning |
|---|---|
Up | Display fills upwards |
Down | Display fills downwards |
Left | Display fills to the left |
Right | Display fills to the right |
Base Tag
The Base Tag allows you to use a single process image for multiple systems with the same structure. This reduces the time and effort required for animation.
The Base Tag must be created in the highest possible group to be able to use it repeatedly. In addition, the Base Tag should be selected at the start of the animation.
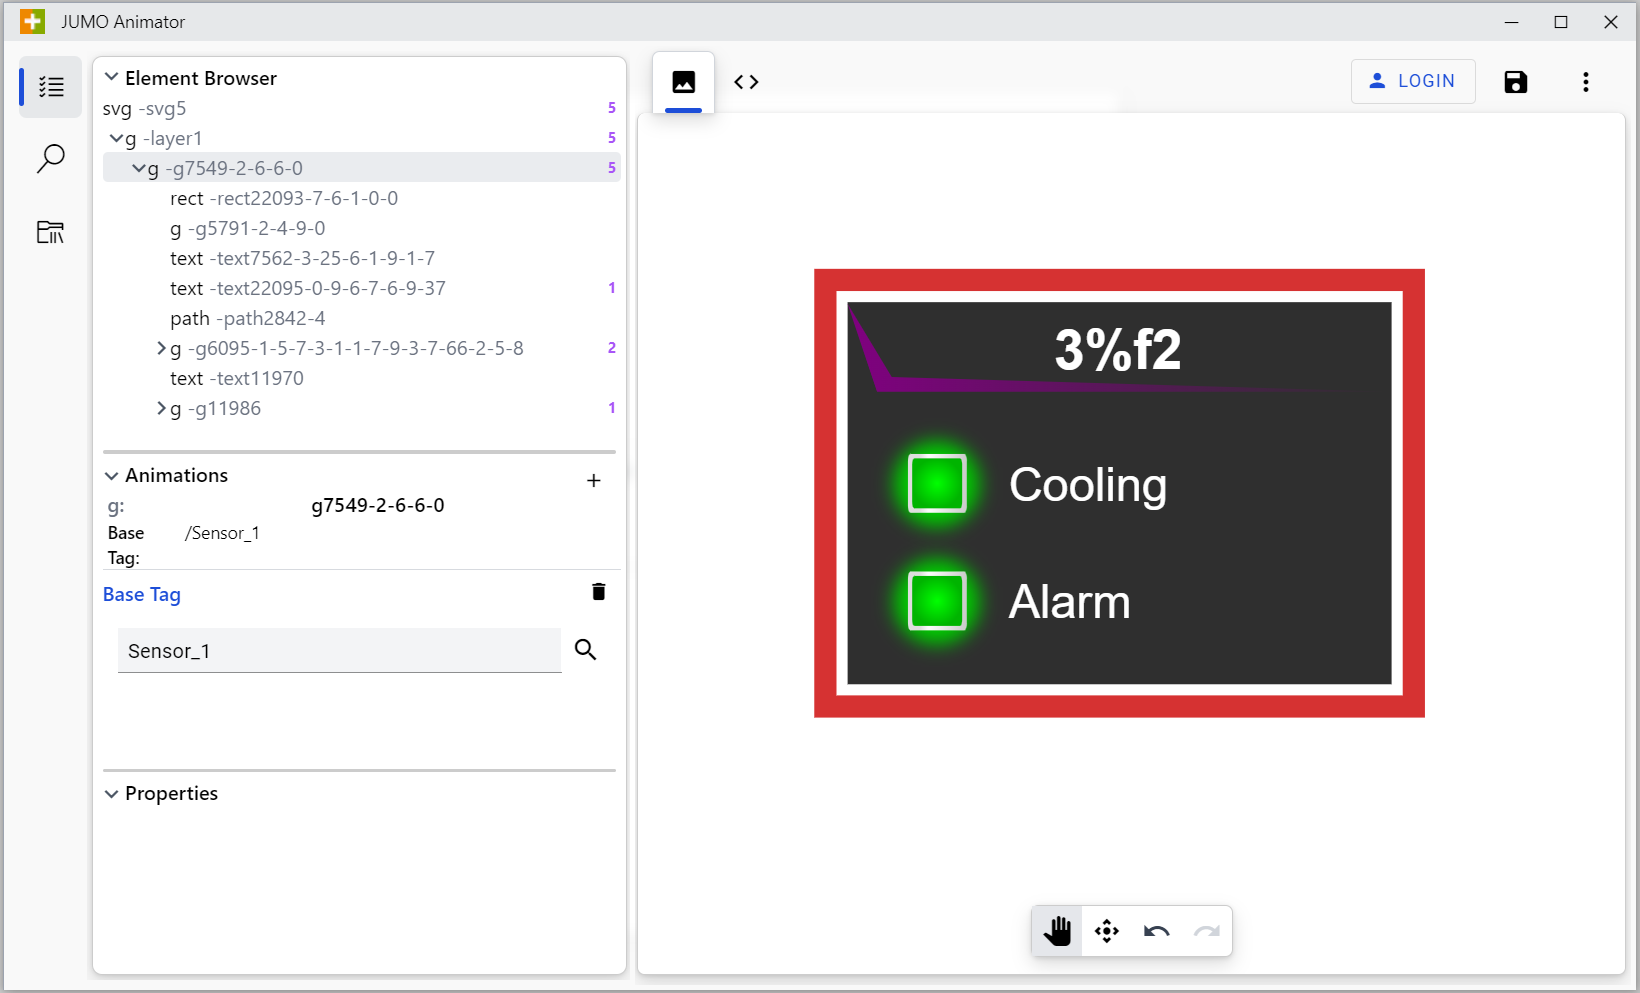
Attribute | Value | Meaning |
|---|---|---|
Base Tag | Group structure (JUMO group structure) | Specify the path in which the signal is located |
jumo-signal | Signal name (not signal number) | Specify the signal name |
Example:
The "Base Tag" animation is used to create recurring process images as a template. Here, for example, a filling level that is used for several process images can be created once and then used multiple times, with different signals. The signals must be named the same in the system. For this you need to create a process image and save it with Base Tag. The created Base Tag can then be selected in the Animator under Entitiy Select in the "Base Tag" animation configuration and can be included for other elements.
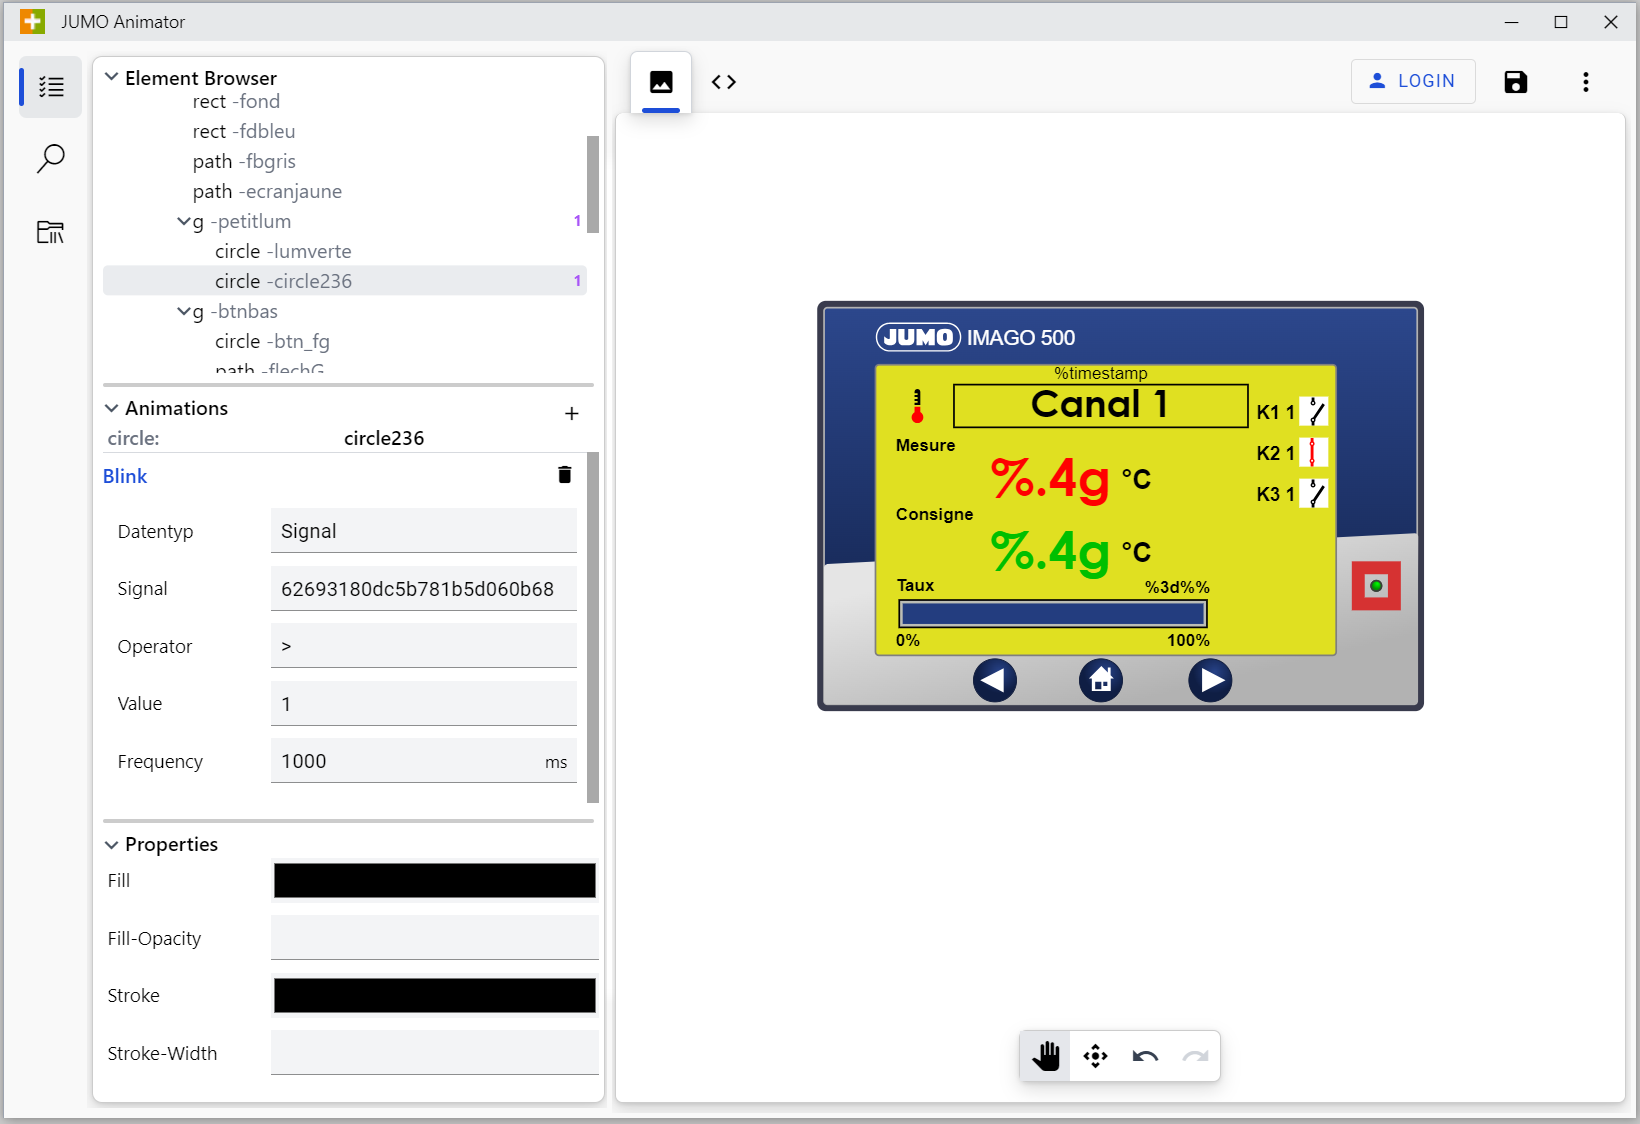
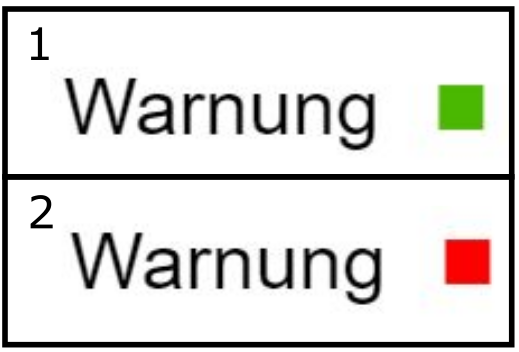
Blinker
The "Blinker" animation allows you to make an element blink. This animation can be used, for example, to point out malfunctions.
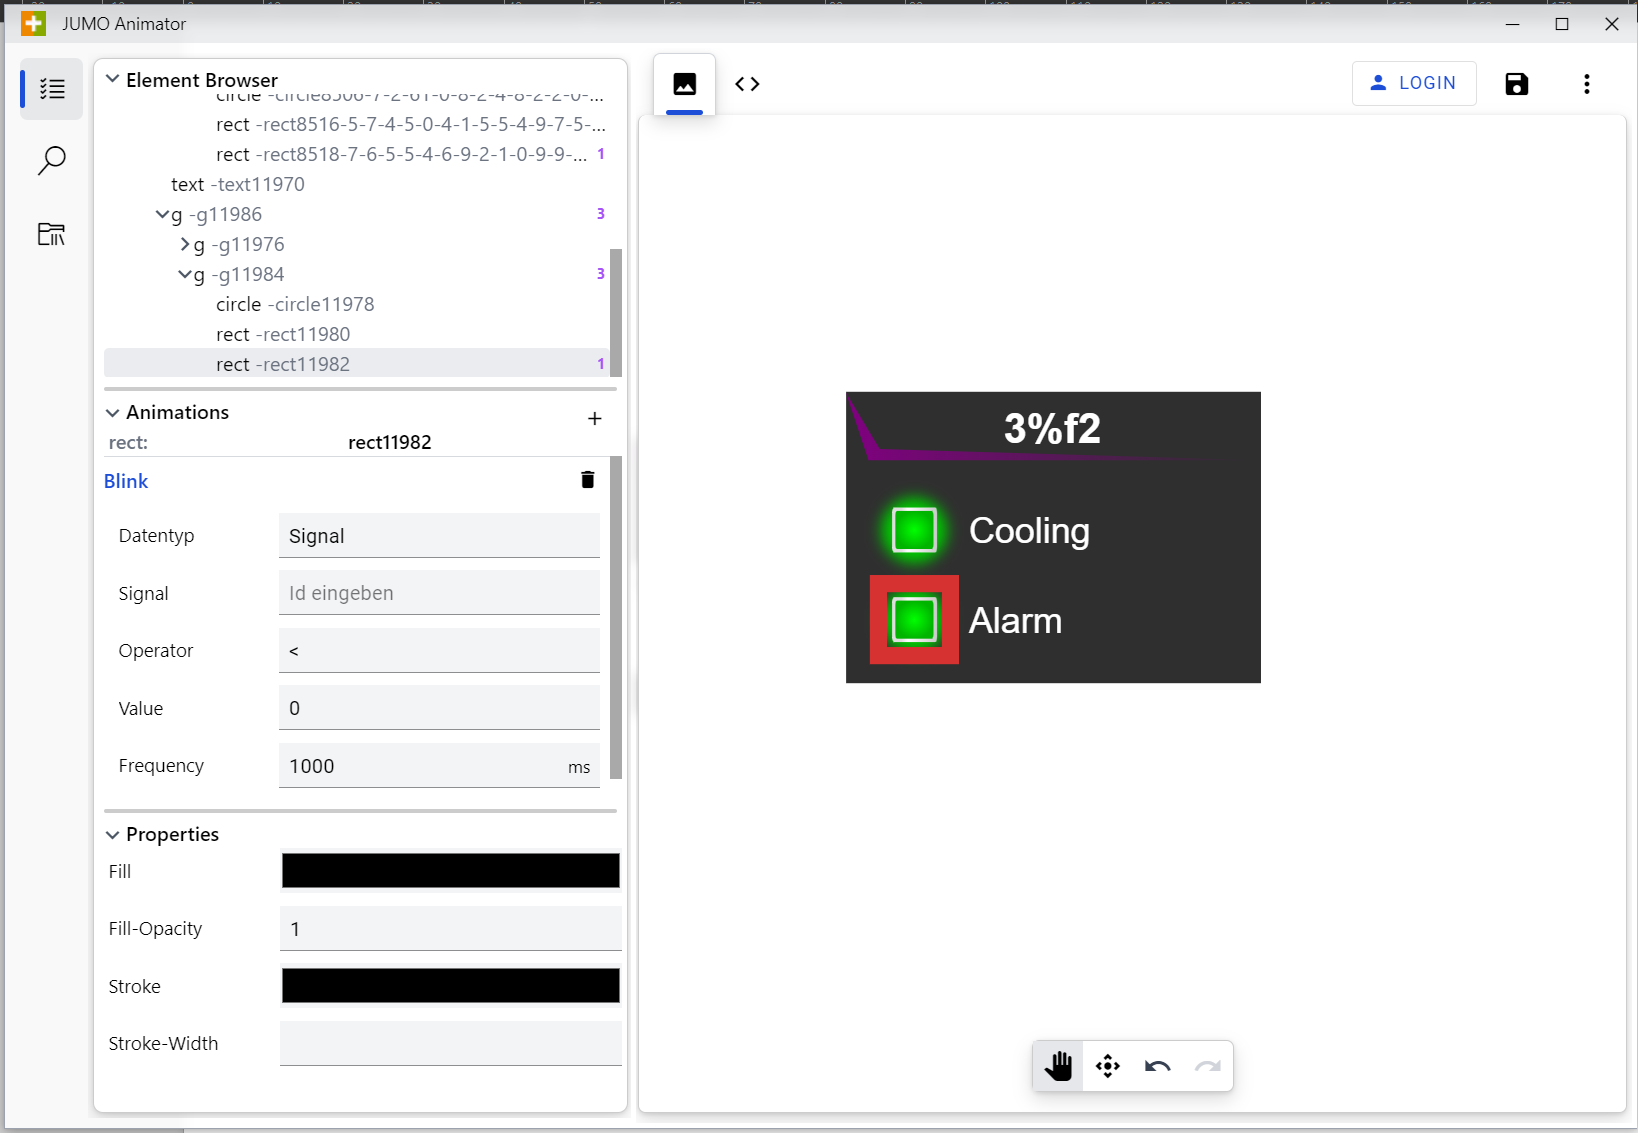
Blinker example:
Attribute | Value | Meaning |
|---|---|---|
Signal | ID | The ID of the input value |
Value | e.g. 0 | The comparison value |
Frequency | e.g. 1000 | Specification of the blink interval in ms |
Comparator | See table | Comparison operator: compares input value with comparison value |
Functionality of the comparison operator / comparator:
The comparison operator or the "Comparator" attribute compares the input value with the set comparison value. For example, if the input value is greater ">" than the comparison value "0", the element starts to blink.
Value of the Comparator / Comparison Operator | Meaning |
|---|---|
< | less than |
> | greater than |
= | equal to |
>= | greater than or equal to |
<= | less than or equal to |
Button
The "Button" animation can be used to realize different functions for a button. There are seven different action options.
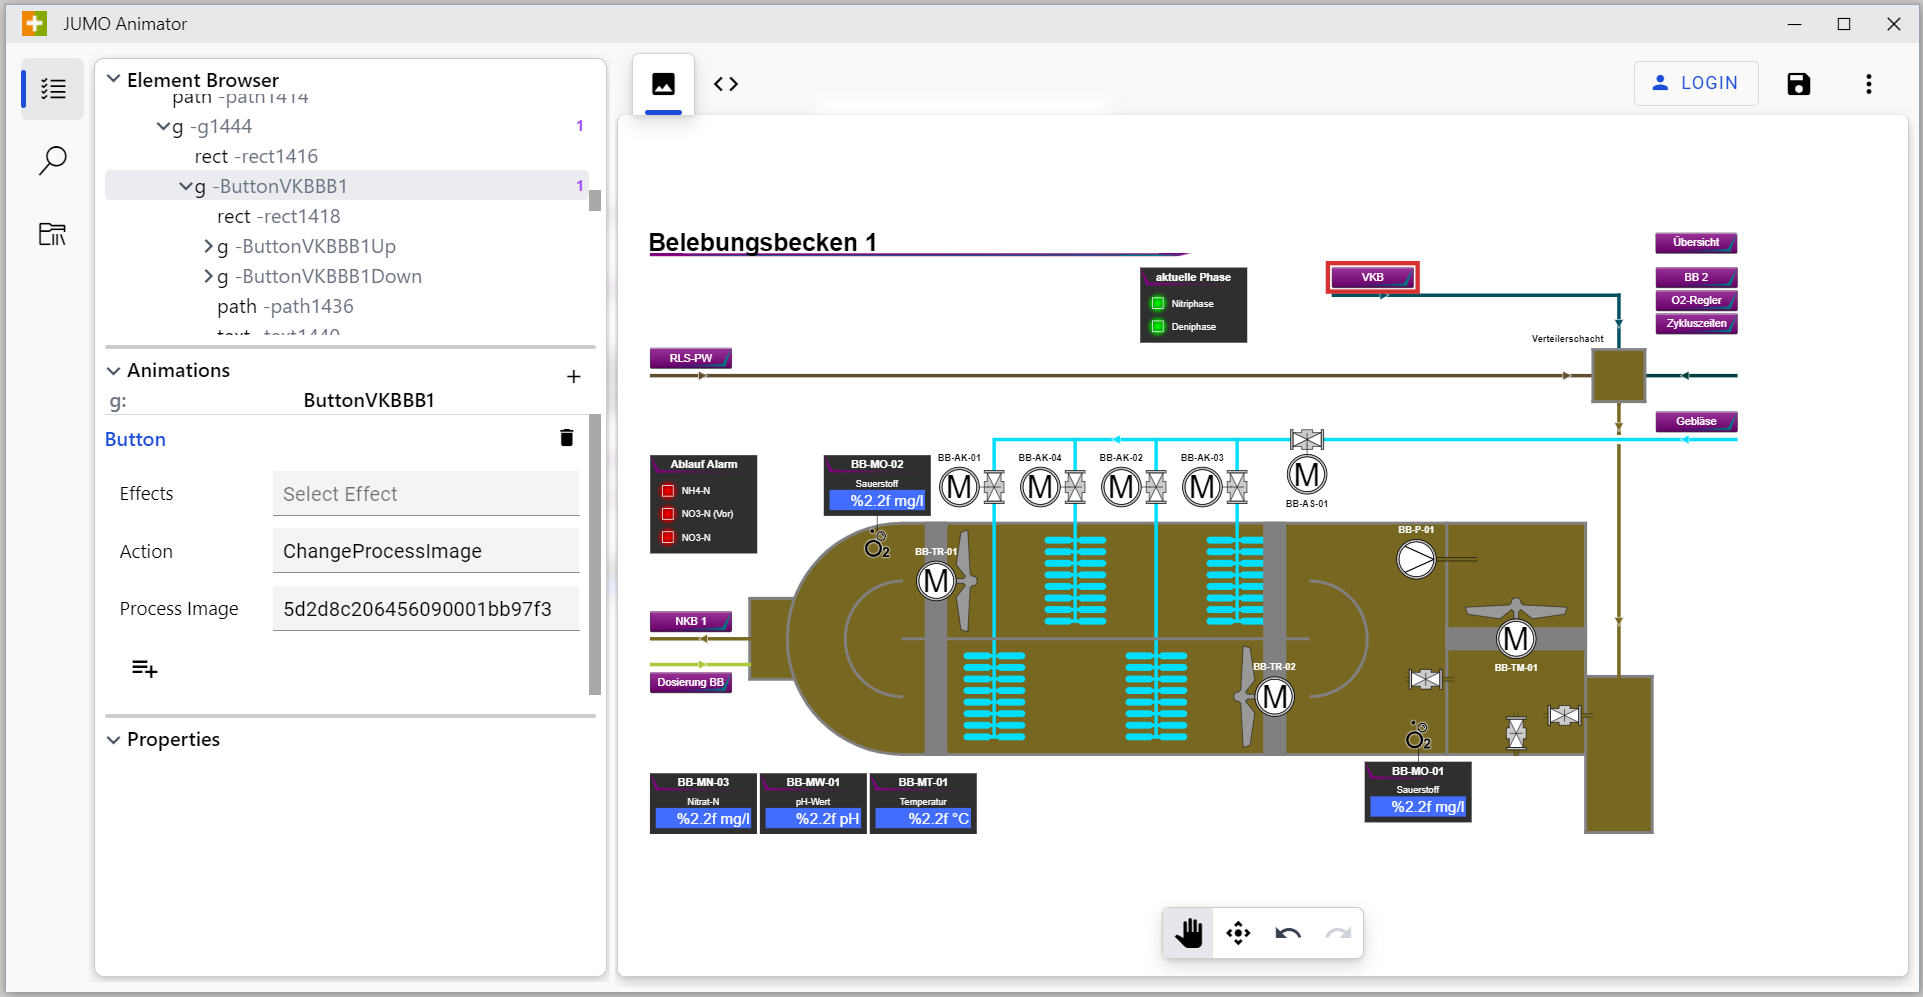
Button example:
Attribute | Value | Meaning |
|---|---|---|
Effects | siehe Tabelle “Effects” | Select which effect the button should have |
Action | see table "Target | Target signal, target image or target datasource |
Action ID | e.g. ID of the process image | Selection of the respective element |
Possible action types for the "Effects" attribute:
Value of the attribute Target | Meaning |
|---|---|
Mouse Pointer | Changes the appearance of the mouse pointer |
Pressed Effects | Creates an effect of button pressing when hovering. |
Possible action types for the attribute „Action“:
Attribute value Action | Meaning |
|---|---|
ChangeProcessImage | Button to another process image |
ChangeDashboard | Button to change the dashboard
|
SetValueDigital | Button for setting a digital value (free input) |
SetValueFixed | Button for setting a fixed value |
SetValueAnalog | Button for setting an analog value (free input) |
StartBatch | Button opens the header data field of a batch and starts or stops it after correct input. |
OpenChart | Button to open the historical chart of a signal |
OpenList | Button to open a list |
Online | Button switches a data source online (activation of live data for 15 min) |
Offline | Button switches a data source offline (immediate deactivation of the live data) |
PopUp | Button to open a popup window |
Color
The "Color" animation allows the user to color objects, depending on the value of the specified signal.
Example:
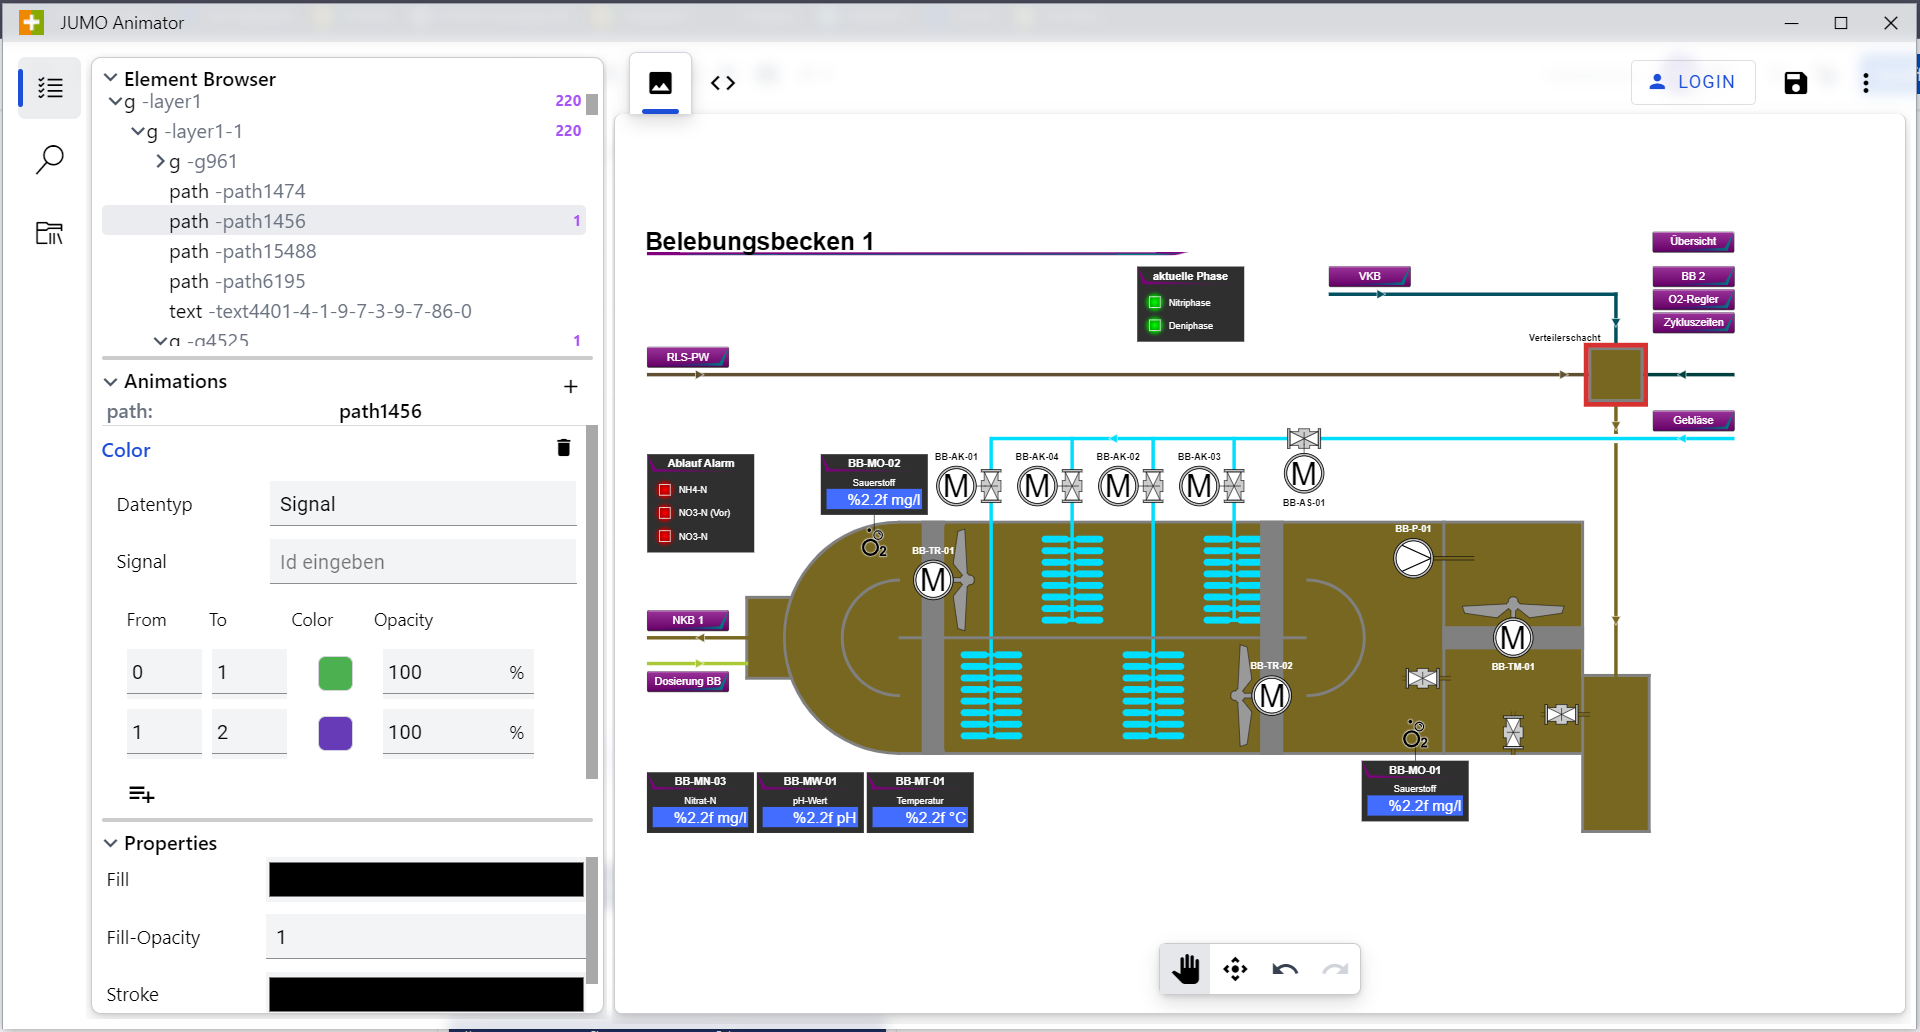
Fixed attribute names for the Color animation:
Attribute | Value | Meaning |
|---|---|---|
From | e.g. 0 | Start of a color area. |
To | e.g. 30 | End of a color area. |
Color | RGB | Here you select a basic color or adjust it using the R, G and B input buttons. The object is colored in this color, provided that the signal is within the range of the "From" and "To" values. |
Text
The "Text" animation can be used to display analog measured values and binary counter values.
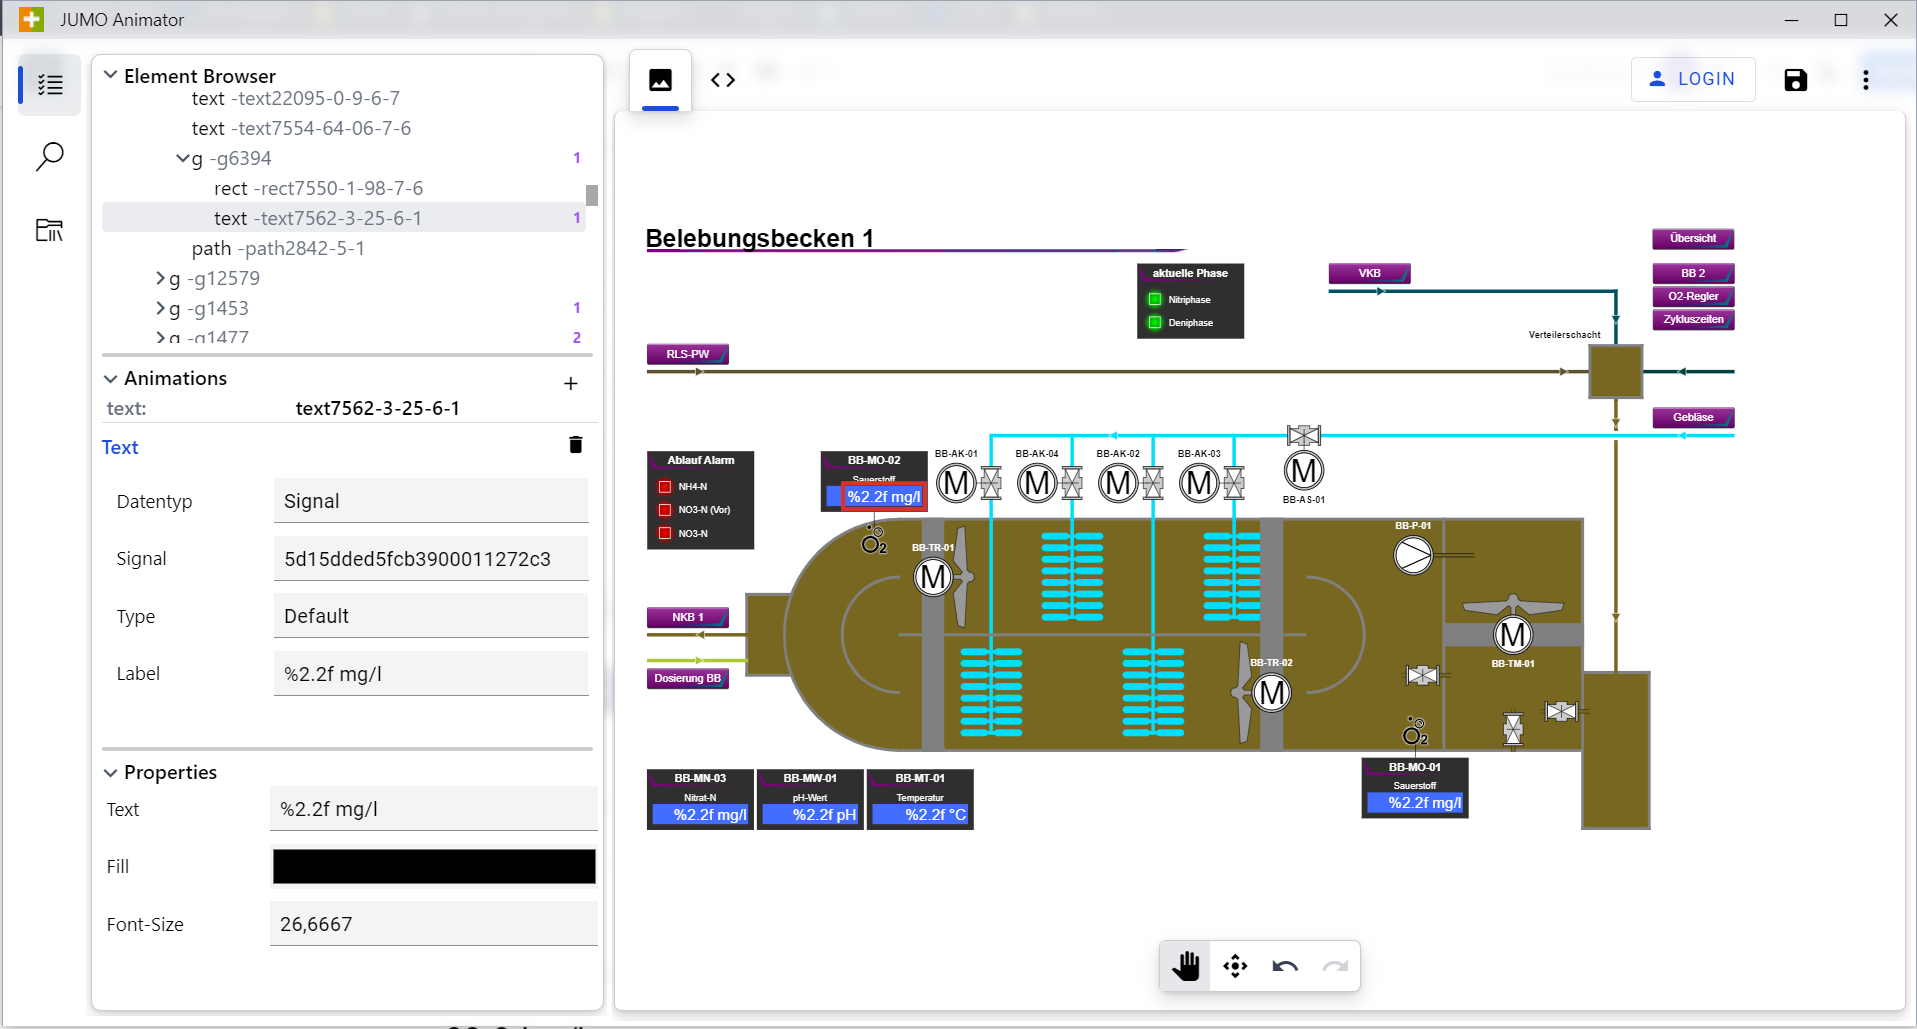
Example of two text fields: Signal value (top) with timestamp (bottom):
Attribute | Value | Meaning |
|---|---|---|
Data type | Signal | Selection of the data type to be included. I.d.R. "Signal |
Signal | ID | The ID of the input value (selection from Entity Select). |
Type | - | Default → Standard Data type |
Label | - | siehe unten |
Label
The value that appears on the input signal is displayed in the text box. For the value to be displayed correctly in the visualization, we need to specify the decimal places and units of measurement beforehand. To do this, the "Label" text field, which should reflect the value later, must contain the following information:
Example: %2.1f m³/h
The % marks the beginning of the formatting symbols and is mandatory.
The 2 indicates that there are 2 digits before the decimal point.
The 1 indicates that there is 1 digit after the decimal point.
The f is the number type, in this case double, i.e. numbers with decimal places.
The unit m³/h is simply placed after the value that is output later.
You can find more detailed information about the form of presentation here: https://www.php.net/manual/de/function.sprintf.php
As of frontend version "4.3.20210709-unstable", STRING variables (text) may be displayed within a process image.
Example: %s
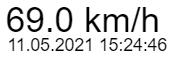
Timestamp
The timestamp displays the date and time in the process image when the selected signal last changed. To display a timestamp in the process image, a signal must be selected in advance by clicking the "Timestamp" button. This timestamp replaces the text in the selected text element on the process image. The "Label" text field disappears after selecting the "Timestamp" button.
In Inkscape, as well as in JUMO Animator, you still see the text that was entered in the text element and not the timestamp values.
Visibility
The "Visibility" animation allows you to make an element visible as well as invisible. You can also set a transparency.
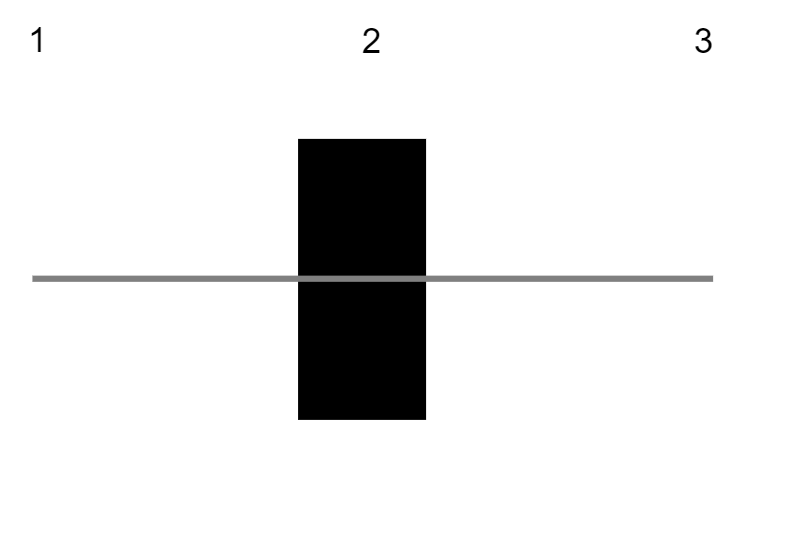
Example: Button 2 → Value too low → Text remains invisible
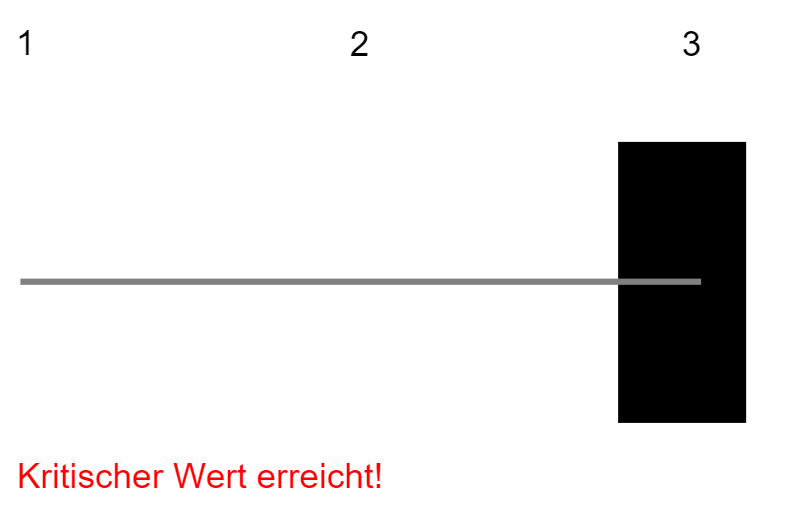
Example: Button 3 → Value exceeded → Text becomes visible
Attribute | Value | Meaning |
|---|---|---|
Signal | ID | The ID of the input value |
Mode | Standard, Inverted, Advanced | Selection of the mode for visibility |
Standard | 0 = Invisible | Digital signal can be made visible or invisible. |
Inverted | 1 = Invisible | Digital signal can be made visible or invisible. |
Advanced | See "From", "To", "Opacity" | The "Advanced" mode can be used to set intervals. A range and an opacity can be set for each interval. Analog signals can also be displayed with this mode |
From | e.g. -50 | Start values of an interval |
To | e.g. 0 | End values of an interval |
Opacity | e.g. 0 | Opacity of an interval. The opacity is shown as a percentage. 0 = No opacity, 100 = Full opacity. |
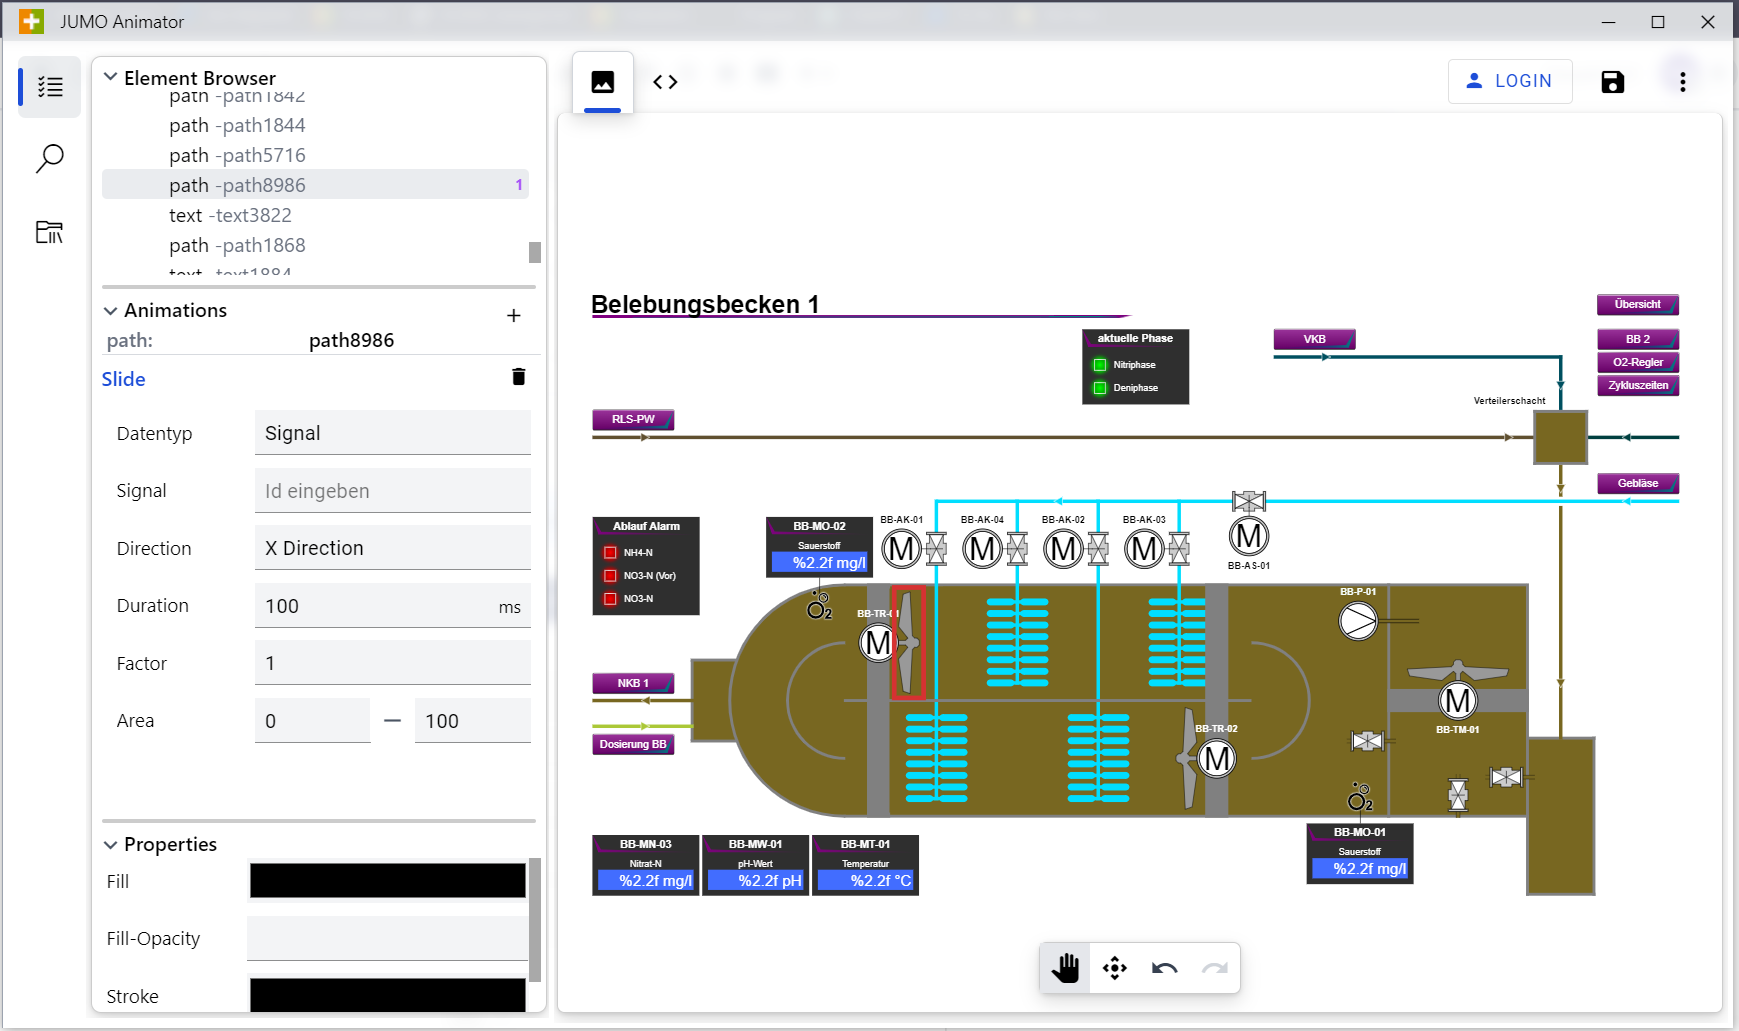
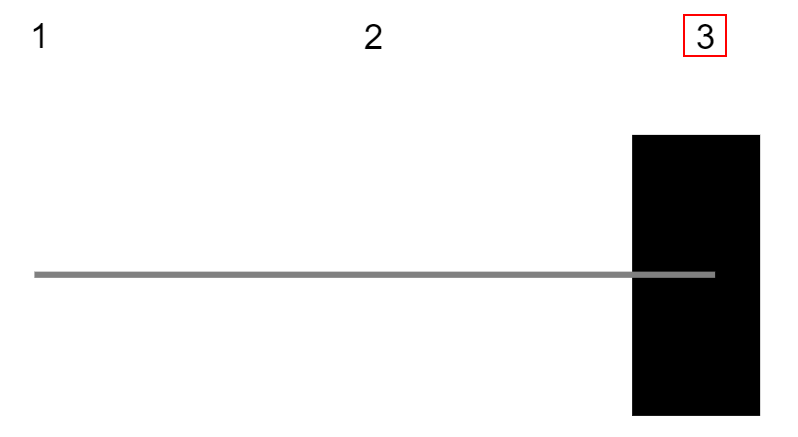
Slide
With the "Slide" animation, objects can be moved either horizontally or vertically.
Example Button 1: Button sets value → Slider moves to left or right depending on value.
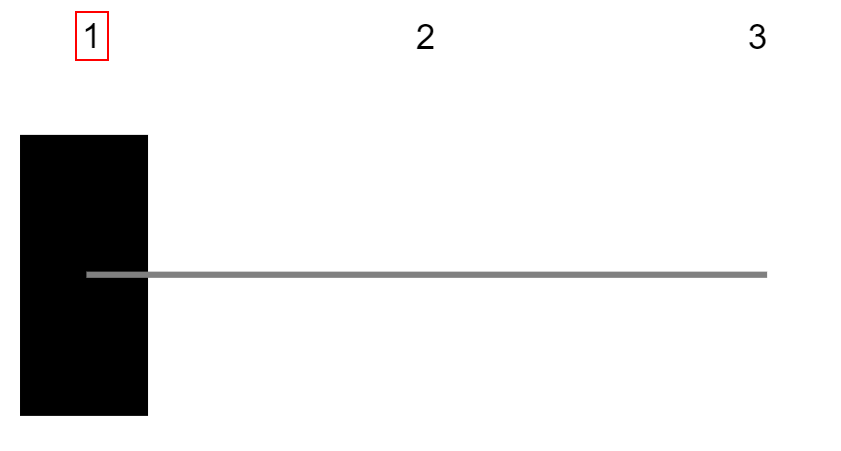
Example Button 3: Button 3 selected → Slider moves to right.
Attribute | Value | Meaning |
|---|---|---|
Signal | ID | The ID of the input value |
Direction | X, Y | Specifies the direction of movement of the object |
Duration | E.g. 5 Sekunden | Duration of the animation (in seconds) |
Factor | E.g. 10 | The "Factor" value is multiplied by the value of the signal. The product indicates how many px the object slides. |
Area (Min) | E.g.100px | If the product of the multiplication between signal value and factor is below the min. value, the min. value is used |
Area (Max) | E.g. 600px | If the product of the multiplication between signal value and factor is above the max. value, the max. value is used |